End-to-end journey
This chapter takes you from nothing to a verified fix in one continuous walk. You sign up, connect your three systems, run your first audit, read the results, decide what is real and what is a false alarm, repair what is real, check that the repair worked, and then set up alerts and scheduled audits so the index stays healthy. Every step tells you which page to open, what to click or type, what you should see, and how to tell that it worked. If a step does not go as described, each one points to the Troubleshooting chapter.
RAGGuard checks that a RAG index is correct. A RAG (retrieval-augmented generation) system answers questions from your documents, so the documents have to be split into pieces and stored in a searchable index. RAGGuard reads three systems, always read-only, and compares them: your documents in Amazon S3 (the source), the table in PostgreSQL where your ingestion pipeline recorded what it did (the manifest), and the vector database that your application searches (the index, in Qdrant). Each comparison is called an audit, and each disagreement it finds is an issue. If any of these words is new, read Concepts you need first. It takes a few minutes and makes everything below easier.
On this page
- Before you start
- The journey at a glance
- Step 1: Sign up
- Step 2: Connect S3, the manifest and Qdrant
- Step 3: Set the target pipeline and the audit policy
- Step 4: Run your first audit
- Step 5: Read the Overview
- Step 6: Read Reconciliation
- Step 7: Triage the issues
- Step 8: Ignore a false alarm with a reason
- Step 9: Create a repair plan
- Step 10: Set up the repair webhook
- Step 11: Trigger the repair
- Step 12: Verify
- Step 13: Approve the cleanup
- Step 14: Run the audit again
- Step 15: Set up alerts
- Step 16: Schedule audits with an API key
- Step 17: Keep monitoring
- Related chapters
Before you start
You need these things. Nothing here is written to; RAGGuard only reads.
| You need | Why | Notes |
|---|---|---|
| An Amazon S3 bucket (or an S3-compatible store) that holds your source documents | The source of truth for what should be searchable | An access key that can list the bucket and read object details: s3:ListBucket on the bucket and s3:GetObject on its objects. Nothing is ever written. |
| A PostgreSQL table where your pipeline records each document it processed | The manifest: what your pipeline believes it did | A database user that can only SELECT is safest. At minimum the table needs a document_id column. |
| A Qdrant vector index (a Qdrant cluster with one or more collections) | The index your application searches | A read-capable API key if your cluster requires one. Each stored vector should carry document_id and source_hash in its payload. |
| Public addresses for all three | In hosted mode RAGGuard refuses private network and localhost addresses | Hosted mode is the normal web app with accounts. See Data sources. |
| (Optional, for the repair steps) a worker that receives a signed webhook | RAGGuard never writes to your systems; your own worker does the re-indexing | A runnable example ships with the product: examples/reference_worker/worker.py. See Integrations. |
One rule matters more than the others, so read it now. Whatever content hash RAGGuard reads from S3 (by default the sha256 entry in each object's user metadata) must be the same value your pipeline records as source_hash in the manifest and in each Qdrant payload. If they differ, every document will look stale.
The journey at a glance
| Step | Page | What you end up with |
|---|---|---|
| 1 | Landing page, then Create account | A private workspace |
| 2 | Data sources | S3, PostgreSQL and Qdrant all shown as Connected |
| 3 | Settings (Pipeline and Policy tabs) | The pipeline you expect, and your audit rules |
| 4 | Reconciliation or the top bar | A finished first audit |
| 5 | Overview | A health score and a picture of what is wrong |
| 6 | Reconciliation | The three counts side by side and every document |
| 7 | Integrity issues | The serious issues understood, with evidence |
| 8 | Integrity issues | False alarms marked Ignored, with a reason |
| 9 | Integrity issues, Repair plans | A Draft repair plan |
| 10 | Integrations | A repair webhook that is Configured |
| 11 | Integrity issues, Repair plans | The plan Triggered |
| 12 | Integrity issues, Repair plans | Each document checked against the real index |
| 13 | Integrity issues, Repair plans | Old vectors removed after your approval |
| 14 | Reconciliation, Overview, Audit history | A better health score and Resolved issues |
| 15 | Alerts | A webhook that tells you about new issues |
| 16 | Integrations | An API key and a scheduled audit |
| 17 | Overview and Audit history | A routine |
Step 1: Sign up
Open: the address of your RAGGuard site. Signed out, you see the public landing page.
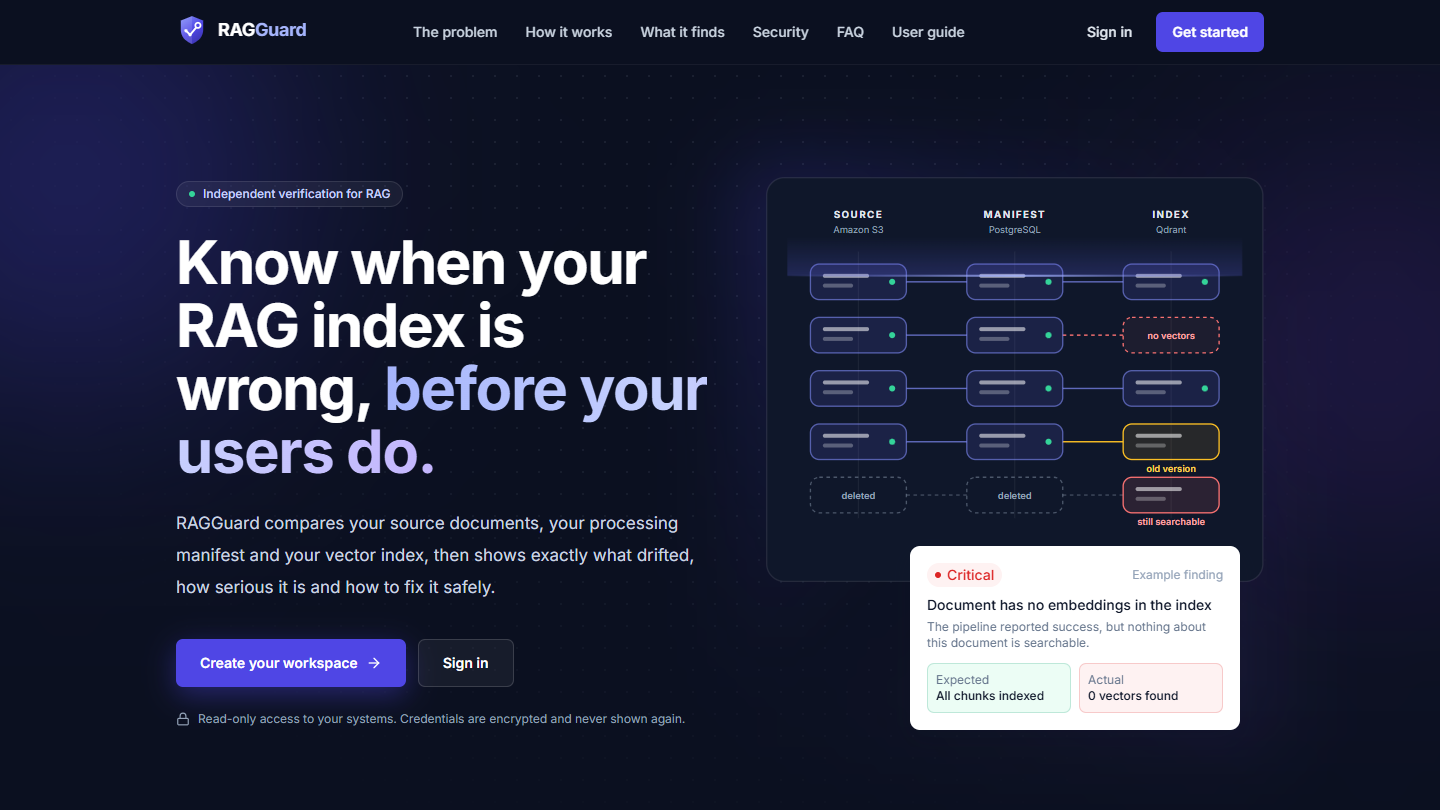
The landing page. The primary button is "Create your workspace".
Do:
- Click Create your workspace. (The top bar also has Sign in and Get started.)
- The form is titled "Create your workspace" and the Create account tab is selected. Type your Email and a Password.
- Choose a password of 10 to 128 characters. It must not be a very common password, must not use only a few different characters (fewer than 4 different characters is refused), and must not contain the part of your email before the
@when that part is 4 characters or longer. - Click Create account.
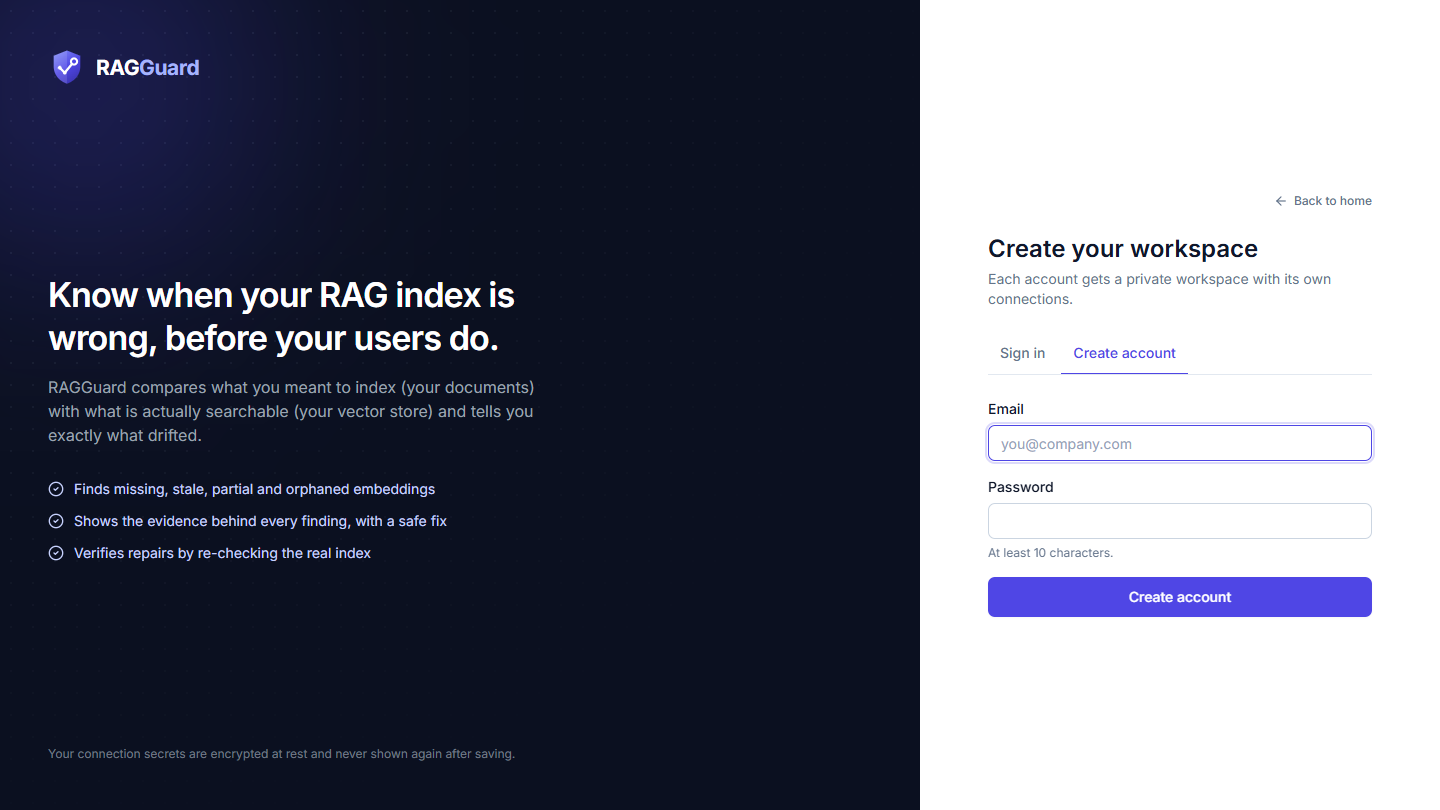
The Create account form. The help text under Password says "At least 10 characters."
You should see: you are signed in and land on Overview. Because nothing is connected yet, the page shows a card titled Connect your data with the text "0 of 3 connected" and three steps: "1. Document source (Amazon S3)", "2. Manifest (PostgreSQL)" and "3. Vector index (Qdrant)", each marked To do.
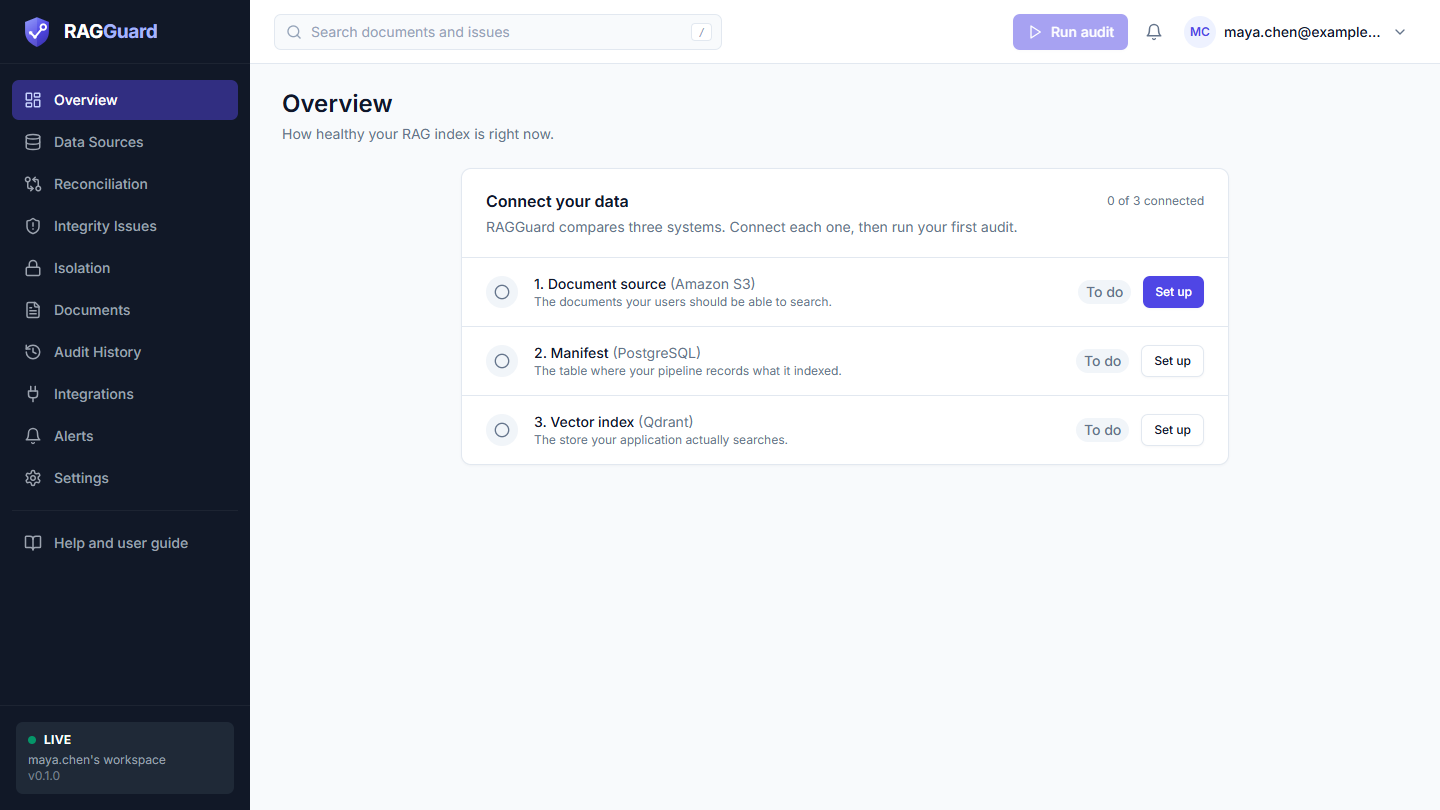
A new workspace. The next step to do has a highlighted Set up button.
At the bottom of the left menu a small card shows LIVE, your workspace name (for example "name's workspace", built from the part of your email before the @) and the version number. Each account owns exactly one private workspace.
What good looks like: you are on Overview, your email appears in the account menu at the top right, and the sidebar shows your workspace name.
Good to know: there is no email verification and no password reset in this version, so keep your password safe. If your server has closed sign-up, the form shows "New sign-ups are closed on this server." and offers only Sign in.
If it did not work: see "Sign-up and sign-in problems" in Troubleshooting. More about the frame of the app is in Sign in and find your way around.
Step 2: Connect S3, the manifest and Qdrant
Open: Data sources in the left menu (or click Set up on the Overview card).
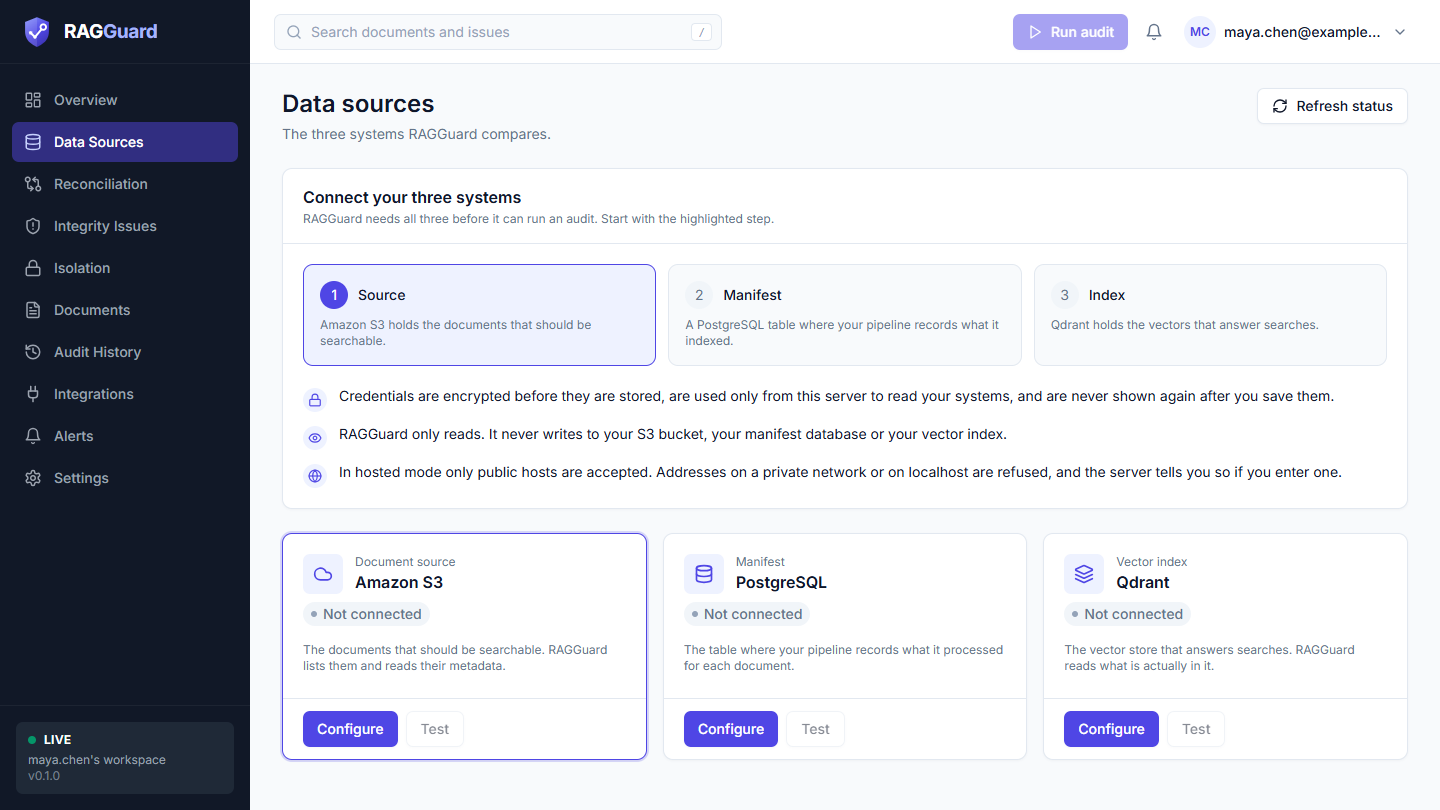
Before anything is connected. The guide card "Connect your three systems" highlights the current step.
You will configure three cards, one after another. For each one the pattern is the same:
- Click Configure on the card. A dialog opens.
- Fill in the fields.
- Click Test connection. This checks what you typed without saving it, and shows one line per check.
- Fix anything red (and read anything amber), then click Test connection again.
- Click Save. (Save is dimmed until you change something.) Secrets are encrypted and never shown again; the form later says "A value is saved".
A test result has an overall verdict, Test passed, Test passed with warnings or Test failed, followed by one line per check with a green tick (ok), an amber triangle (warning) or a red cross (failed). A failed test names exactly what to change.
Step 2a: Amazon S3 (the source)
Click Configure on Amazon S3 (eyebrow "Document source"). The dialog is titled "Document source: Amazon S3".
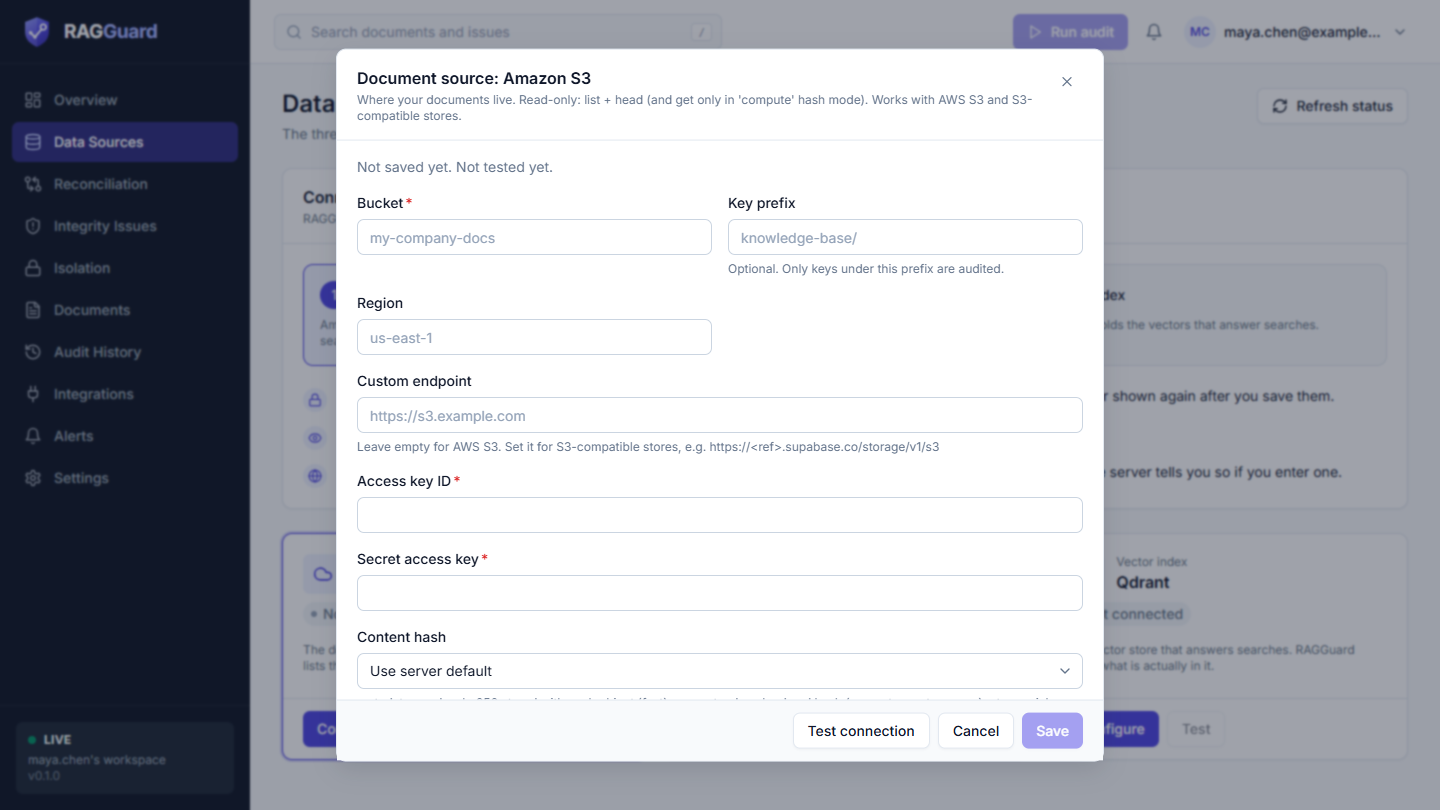
The top of the S3 dialog: Bucket, Key prefix, Region, Custom endpoint, Access key ID and Secret access key.
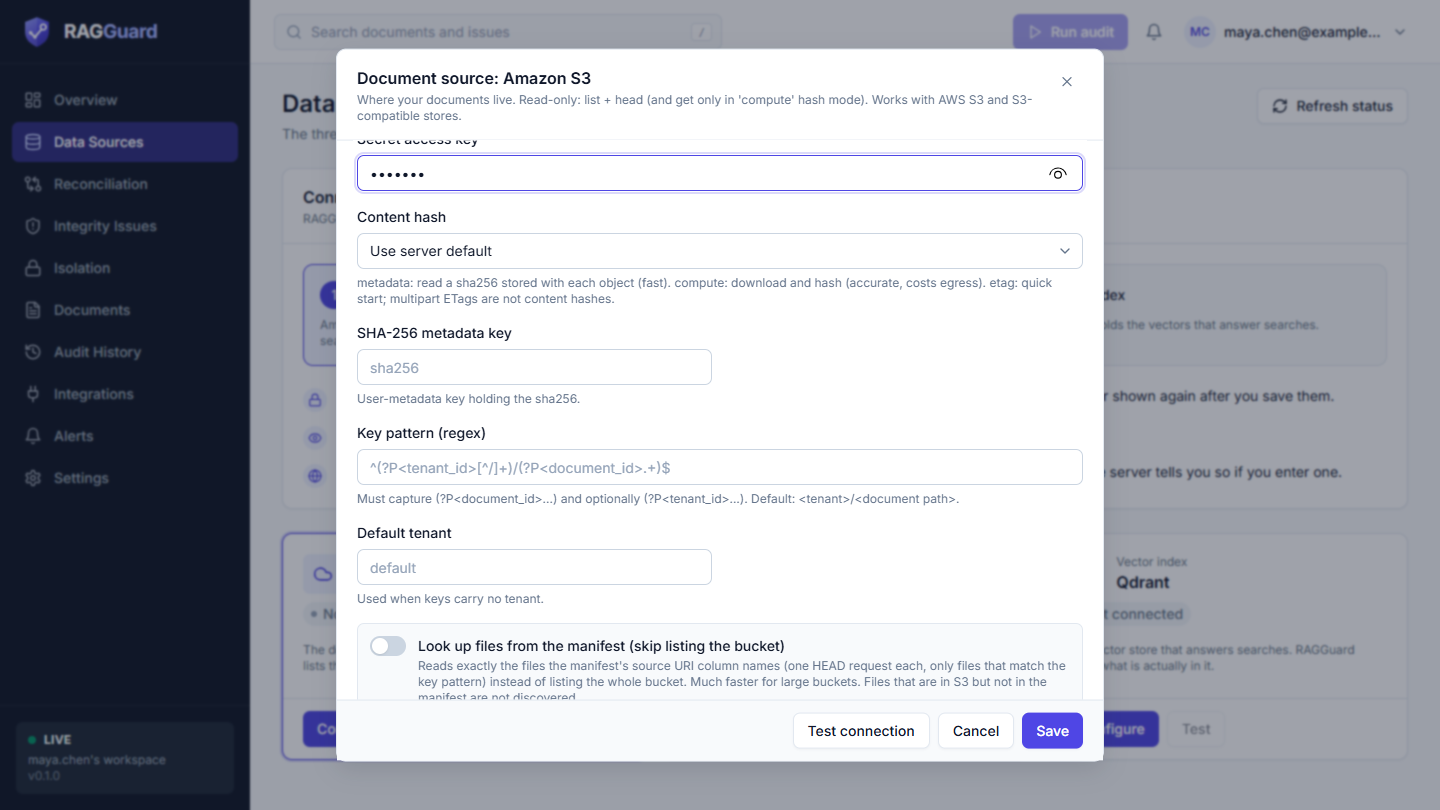
The lower fields: Content hash, SHA-256 metadata key, Key pattern, Default tenant and the lookup switch.
Fill in:
- Bucket (required), and Region (for example
ap-south-1). - Access key ID and Secret access key (both required, both secret).
- Leave Custom endpoint empty for AWS. Use it only for S3-compatible stores.
- Key prefix if you only want one folder audited.
- Key pattern. The default expects
tenant/path/to/document.pdf, where the first folder is the tenant (a customer or business unit whose documents must stay separate). For a flat bucket with no tenants use^(?P<document_id>.+)$. - Leave Content hash on its default (
metadata) if your objects carry a SHA-256 in user metadata.
Click Test connection.
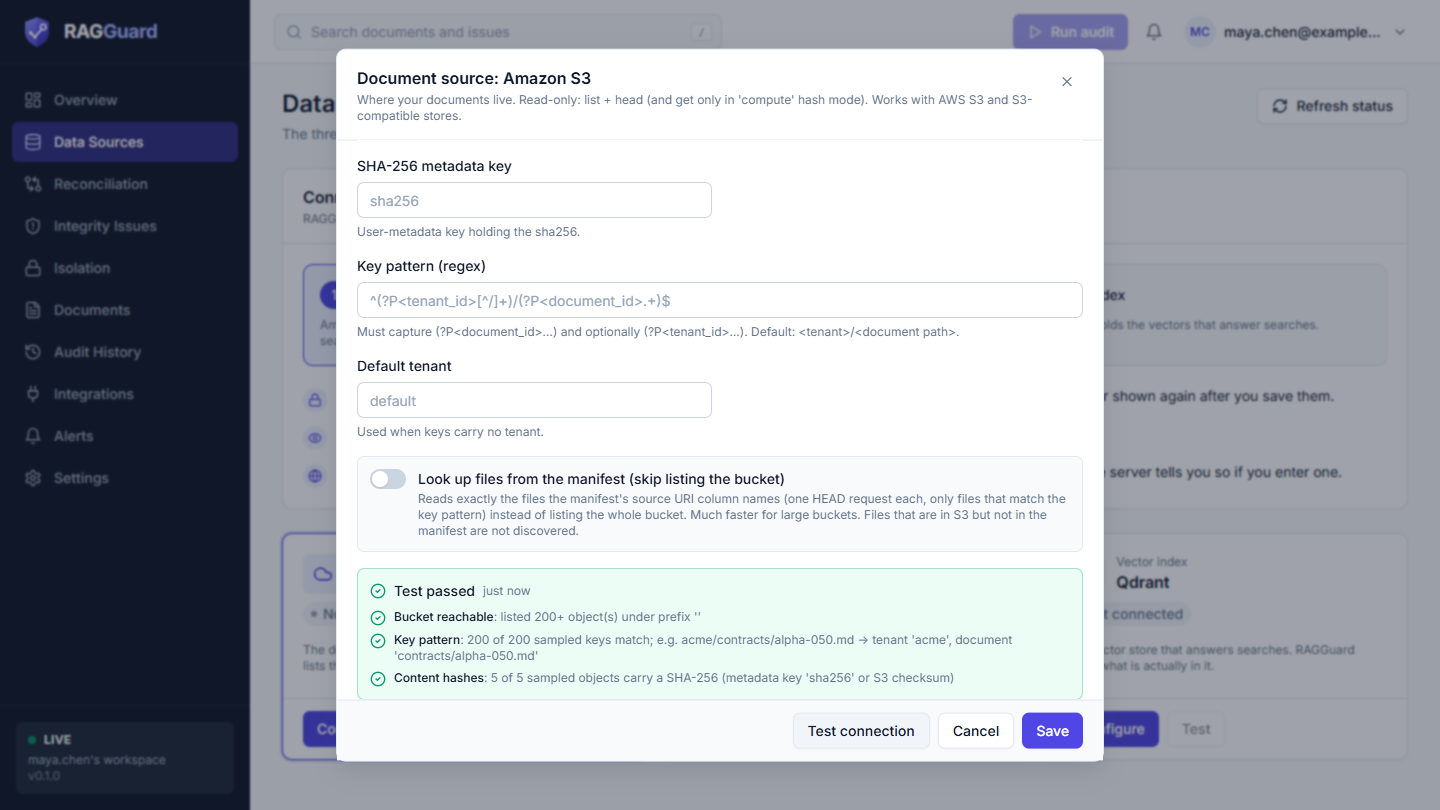
A passing S3 test. Each line is one check.
You should see, for example:
| Check | A good result looks like |
|---|---|
| Bucket reachable | "listed N object(s) under prefix '...'" (a + after N means the bucket has more than the 200 sampled) |
| Key pattern | "N of N sampled keys match; e.g. KEY -> tenant 'TENANT', document 'DOCUMENT'" |
| Content hashes | "5 of 5 sampled objects carry a SHA-256 (metadata key 'sha256' or S3 checksum)" |
Two other lines appear only when something is off: Documents found (amber, "No objects under this bucket/prefix yet. The audit will report an empty source.") and Object metadata (red). Click Save. A toast says "Source documents (S3) saved".
Step 2b: PostgreSQL (the manifest)
Click Configure on PostgreSQL (eyebrow "Manifest"). The dialog is titled "Manifest: PostgreSQL".
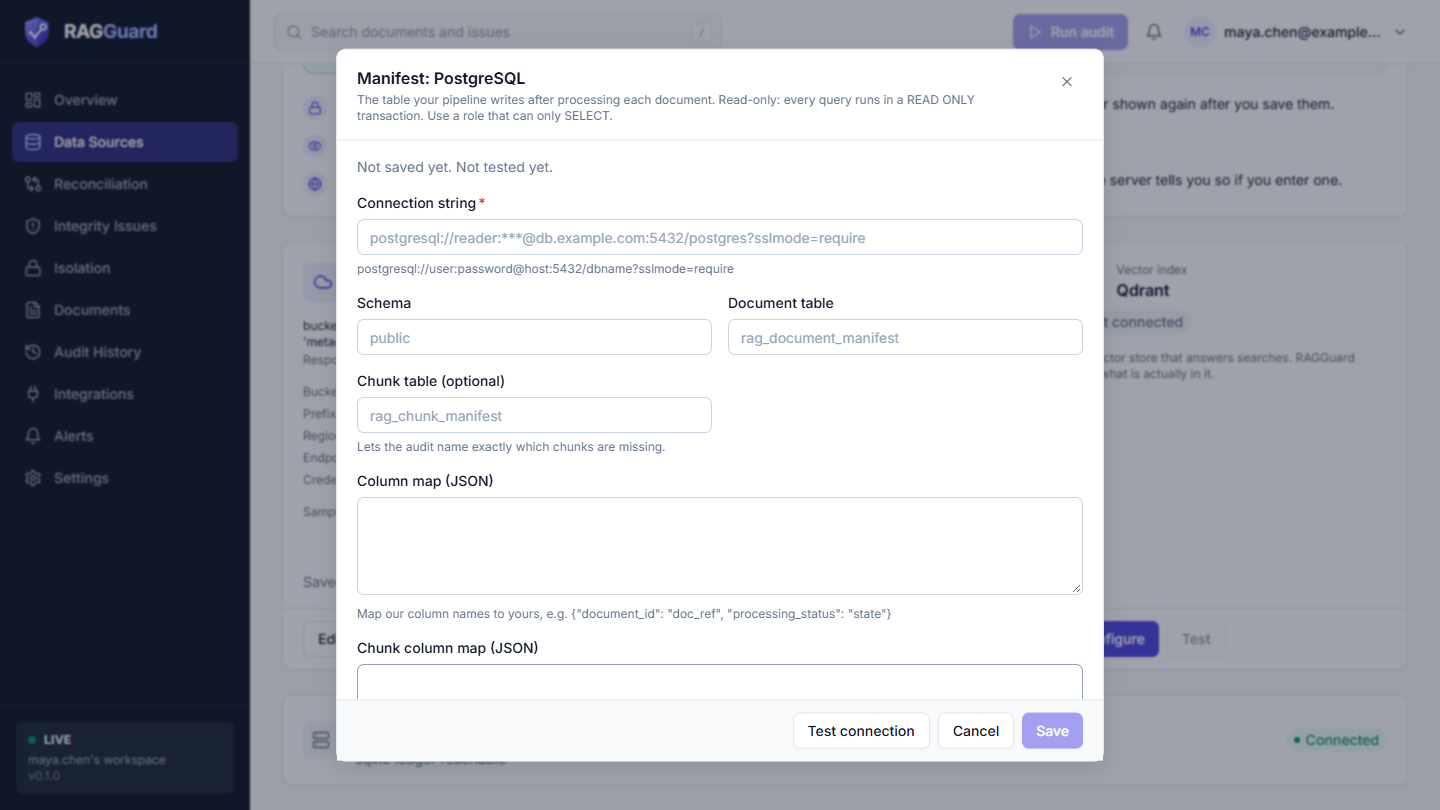
The manifest dialog: Connection string, Schema, Document table, Chunk table, Column map and Chunk column map.
Fill in:
- Connection string (required, secret):
postgresql://user:password@host:5432/dbname?sslmode=require. - Schema (default
public) and Document table (defaultrag_document_manifest). - Chunk table (optional) if your pipeline records one row per chunk. With it RAGGuard can name exactly which chunks are missing.
- Column map (JSON) if your column names differ, for example
{"document_id": "doc_ref"}. The names on the left are RAGGuard's, the names on the right are yours.
Click Test connection.
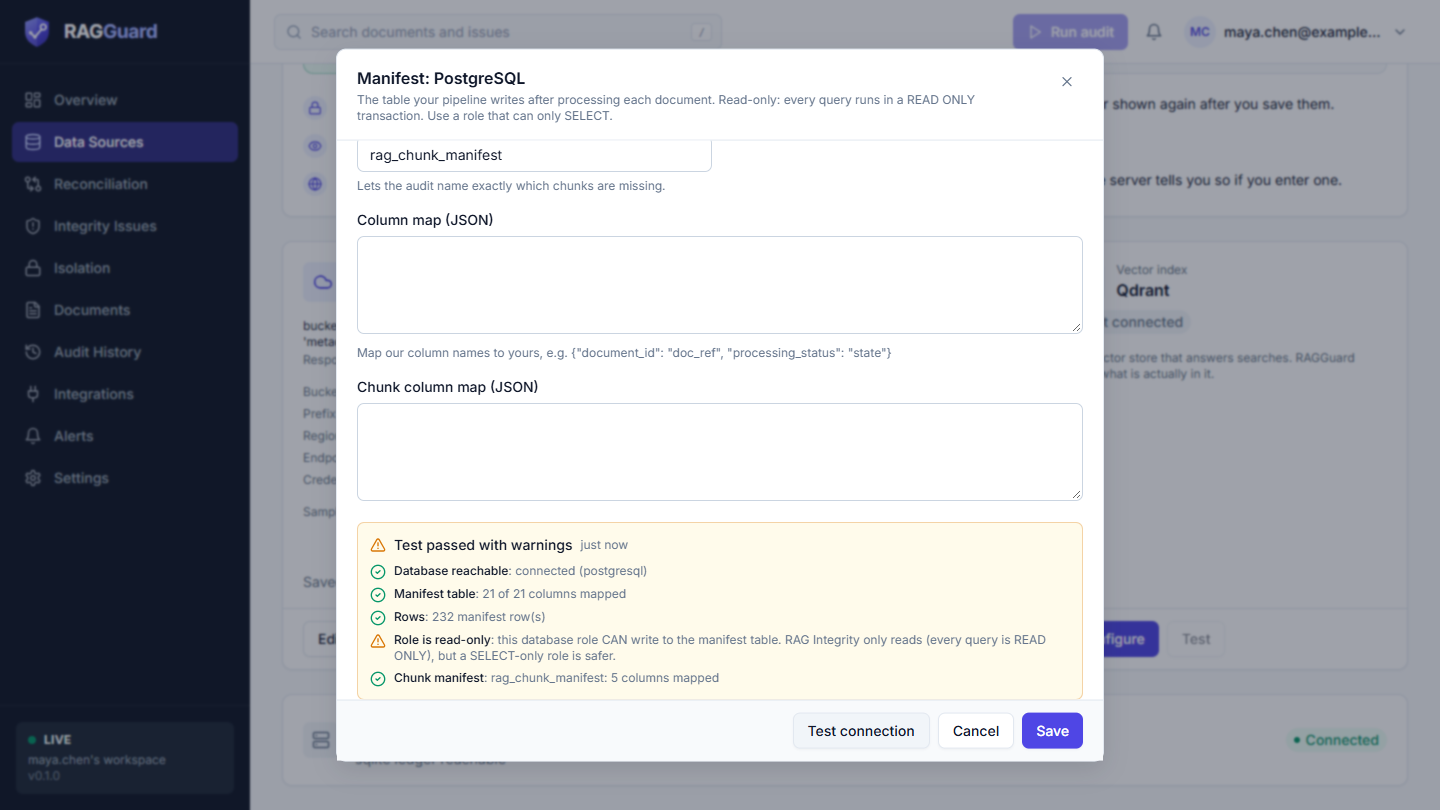
A passing manifest test.
You should see, for example:
| Check | A good result looks like |
|---|---|
| Database reachable | "connected (postgresql)" |
| Manifest table | "N of 21 columns mapped" |
| Rows | "N manifest row(s)" |
| Role is read-only | "this role has no write privileges on the manifest table" (amber if your role can write: the test still passes, but a SELECT-only role is safer) |
| Chunk manifest | amber "not configured: ..." when you did not give a chunk table, which is fine |
If Columns used for checks is amber, some columns RAGGuard uses (source_hash, processing_status, expected_chunk_count, indexed_chunk_count) were not found, so the matching checks are weaker. Map them with the column map. Click Save.
Step 2c: Qdrant (the index)
Click Configure on Qdrant (eyebrow "Vector index"). The dialog is titled "Vector index: Qdrant".
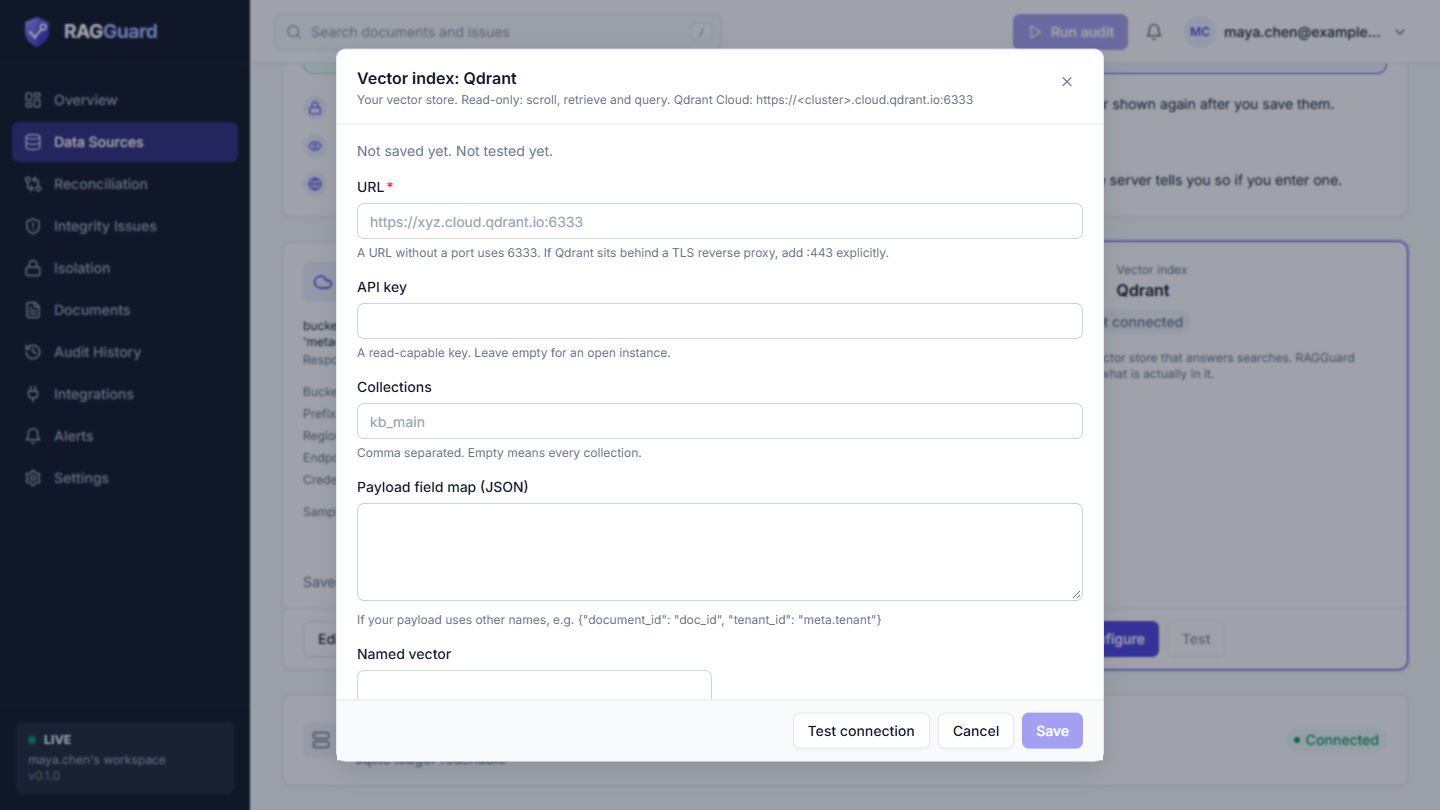
The Qdrant dialog: URL, API key, Collections, Payload field map, Named vector and the Detect empty embeddings switch.
Fill in:
- URL (required), for example
https://xyz.cloud.qdrant.io:6333. A URL without a port uses 6333. - API key (secret), if your cluster needs one. A read-capable key is enough.
- Collections: the names to audit, separated by commas. Leave it empty to audit every collection.
- Leave Payload field map (JSON) empty unless your payload field names differ (for example
{"document_id": "doc_id"}). - Leave Detect empty embeddings off for now. It reads the vectors themselves and is slower and heavier for Qdrant.
Click Test connection.
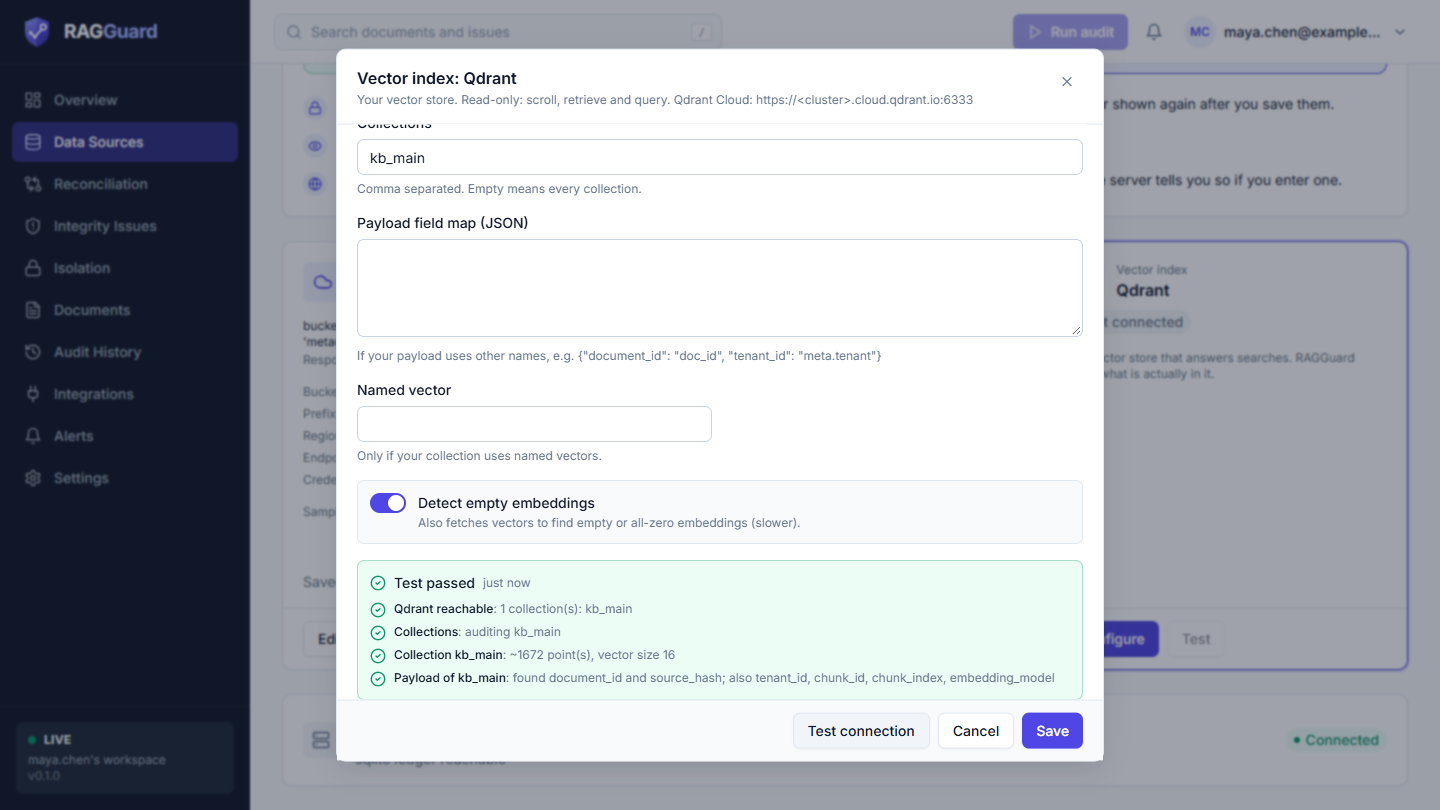
A passing Qdrant test.
You should see, for example:
| Check | A good result looks like |
|---|---|
| Qdrant reachable | "N collection(s): name, name" |
| Collections | "auditing NAMES" |
| Collection NAME | "~N point(s), vector size D" |
| Payload of NAME | "found document_id and source_hash; also tenant_id, chunk_id, ..." |
Click Save.
Step 2d: Check the three cards
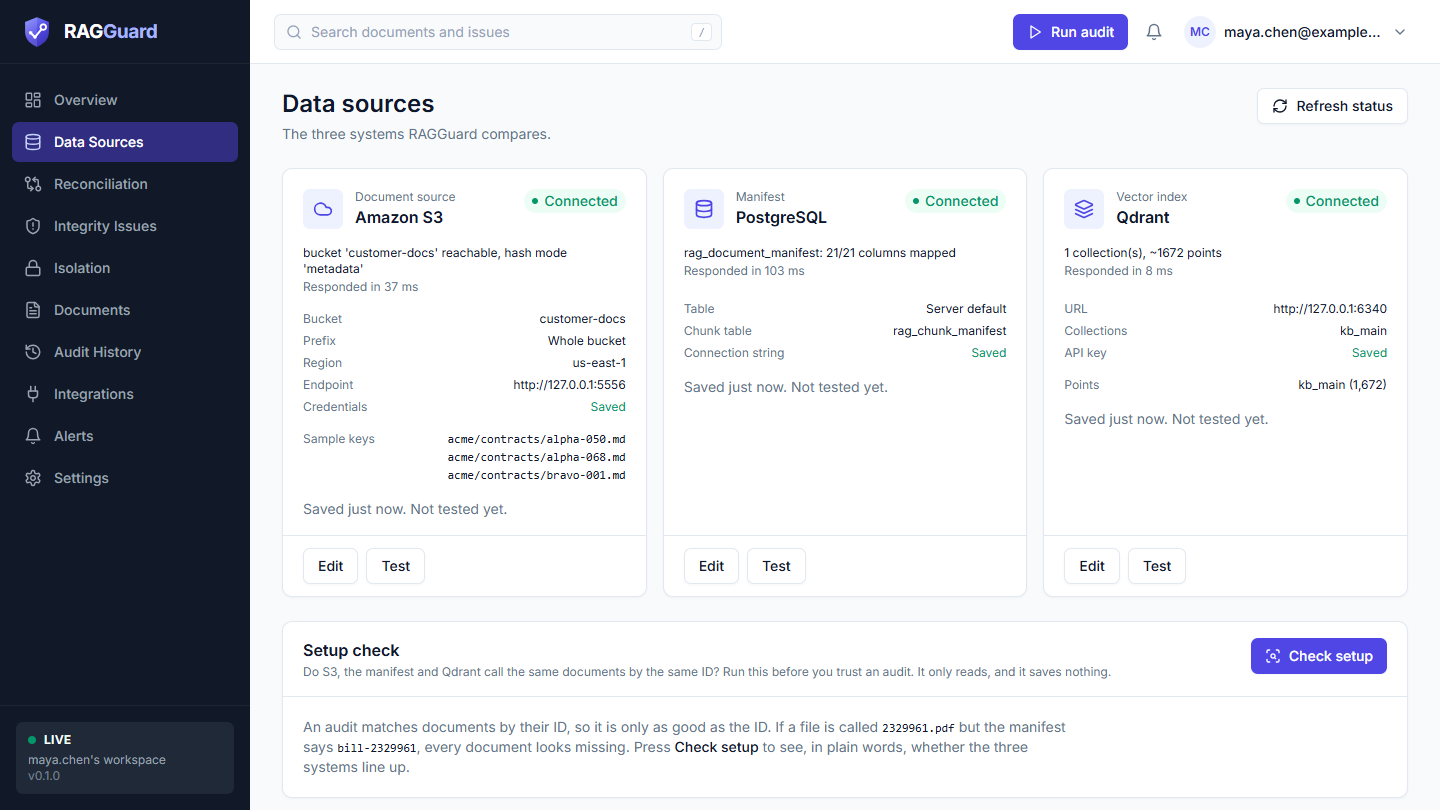
All three systems connected, plus the read-only Issue ledger card.
What good looks like: all three cards show the green badge Connected, each with a live line such as "bucket '...' reachable, hash mode 'metadata'" and "Responded in N ms". The Issue ledger card (where audit runs, issues and repair plans are stored) is also Connected. The guide card at the top is gone, and Run audit in the top bar is now enabled. If a card shows Error (red), click Test on that card for a plain-language explanation. Refresh status re-checks all three.
If it did not work: see "Connection test messages" and "A data source card says Error" in Troubleshooting. Field-by-field detail is in Data sources.
Step 3: Set the target pipeline and the audit policy
Two optional settings shape how RAGGuard judges your documents. They are in Settings.
Open: Settings in the left menu, then the Pipeline tab.
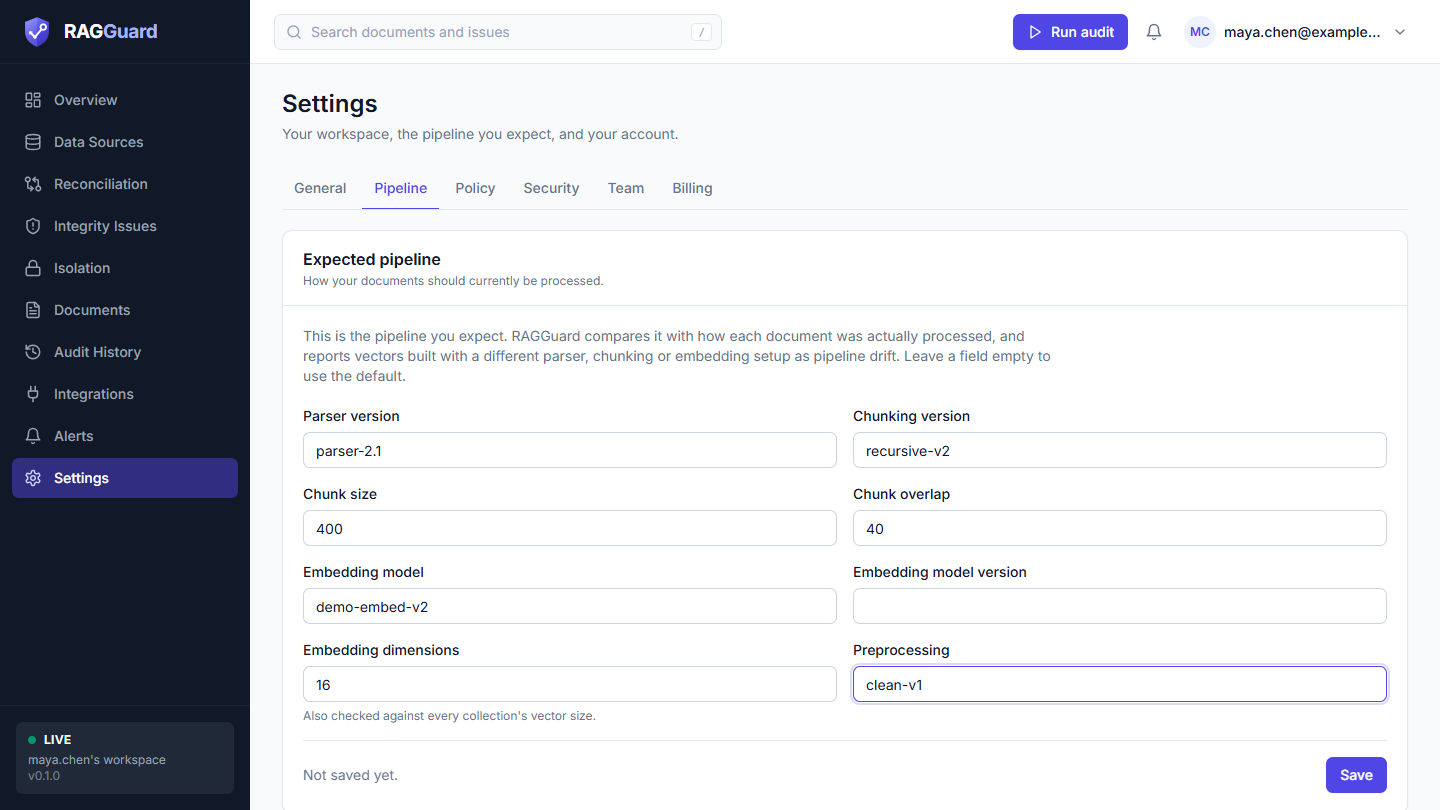
The Pipeline tab. All fields are optional.
Do (Pipeline tab, card "Expected pipeline"): enter how your documents should currently be processed: Parser version, Chunking version, Chunk size, Chunk overlap, Embedding model, Embedding model version, Embedding dimensions and Preprocessing. Then click Save. A vector whose recorded setup conflicts with this target is reported as Pipeline drift. If you leave every field empty, RAGGuard only reports vectors of a single document that were built with different setups. If you are unsure, leave a field empty: a wrong value makes every document look drifted. Also note that Embedding dimensions is compared with every collection's vector size.
Open: the Policy tab.
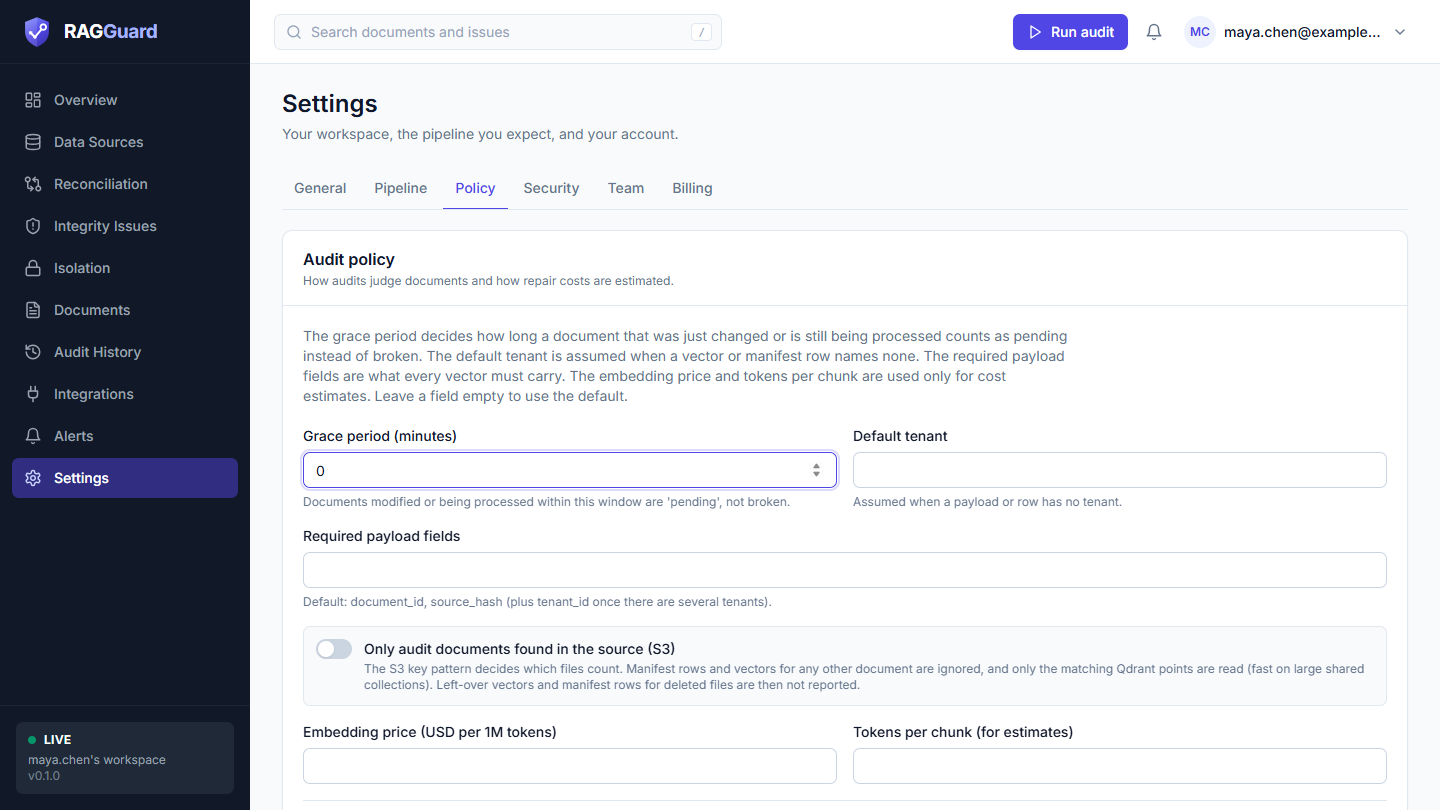
The Policy tab, with the "Only audit documents found in the source (S3)" switch.
Do (Policy tab, card "Audit policy"):
- Grace period (minutes) (default 10): a document changed or still being processed within this window is Pending, not broken. Raise it if your ingestion is slow.
- Default tenant (default
default): the tenant to assume when a manifest row or vector names none. - Required payload fields: leave empty. RAGGuard then requires
document_idandsource_hash(andtenant_idonce there is more than one tenant). - Leave the switch Only audit documents found in the source (S3) off, unless your manifest or index is shared with more than the bucket covers.
- Embedding price (USD per 1M tokens) (default 0.13) and Tokens per chunk (for estimates) (default 512) only drive the cost estimates in repair plans. Set them to your real numbers if you want sensible costs.
Click Save.
What good looks like: after each Save a toast says "Target pipeline saved" or "Audit policy saved", and the form says "No unsaved changes."
If it did not work: a red line under a field names the problem ("Chunk size: must be between 1 and 1000000"). Format messages are listed under "Other messages while connecting" in Troubleshooting, and every field is explained in Settings.
Step 4: Run your first audit
Open: Reconciliation in the left menu. (You can also use Run audit in the top bar, or Run first audit on an empty Overview.)
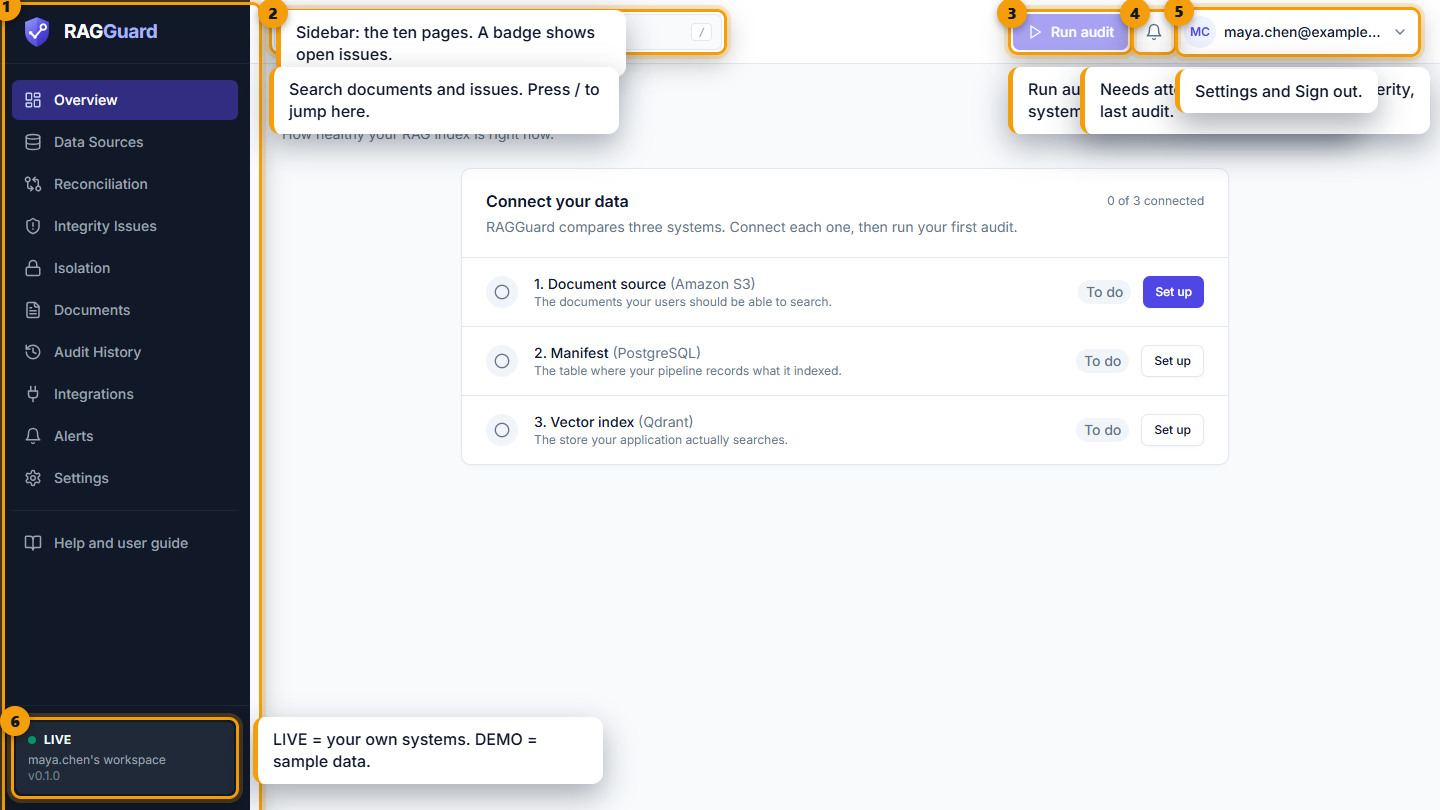
The frame of the app. Marker 3 is the Run audit button.
Do: click Run full audit. (Scoped audit checks one tenant only, which you will use later.)
You should see: the button changes to Audit running, and a toast says "Running audit…" with "Comparing source, manifest and index". Depending on how your server is hosted, either the request waits until the audit is done, or an Audit in progress card with a moving bar appears and the page updates when it finishes. On a hosted server an audit has a time budget of 270 seconds. When it finishes, a toast says "Audit complete" and "N integrity issues found." (or "No integrity issues found.").
What good looks like: the toast "Audit complete", and a new row in Audit history with Type Full and Status Completed.
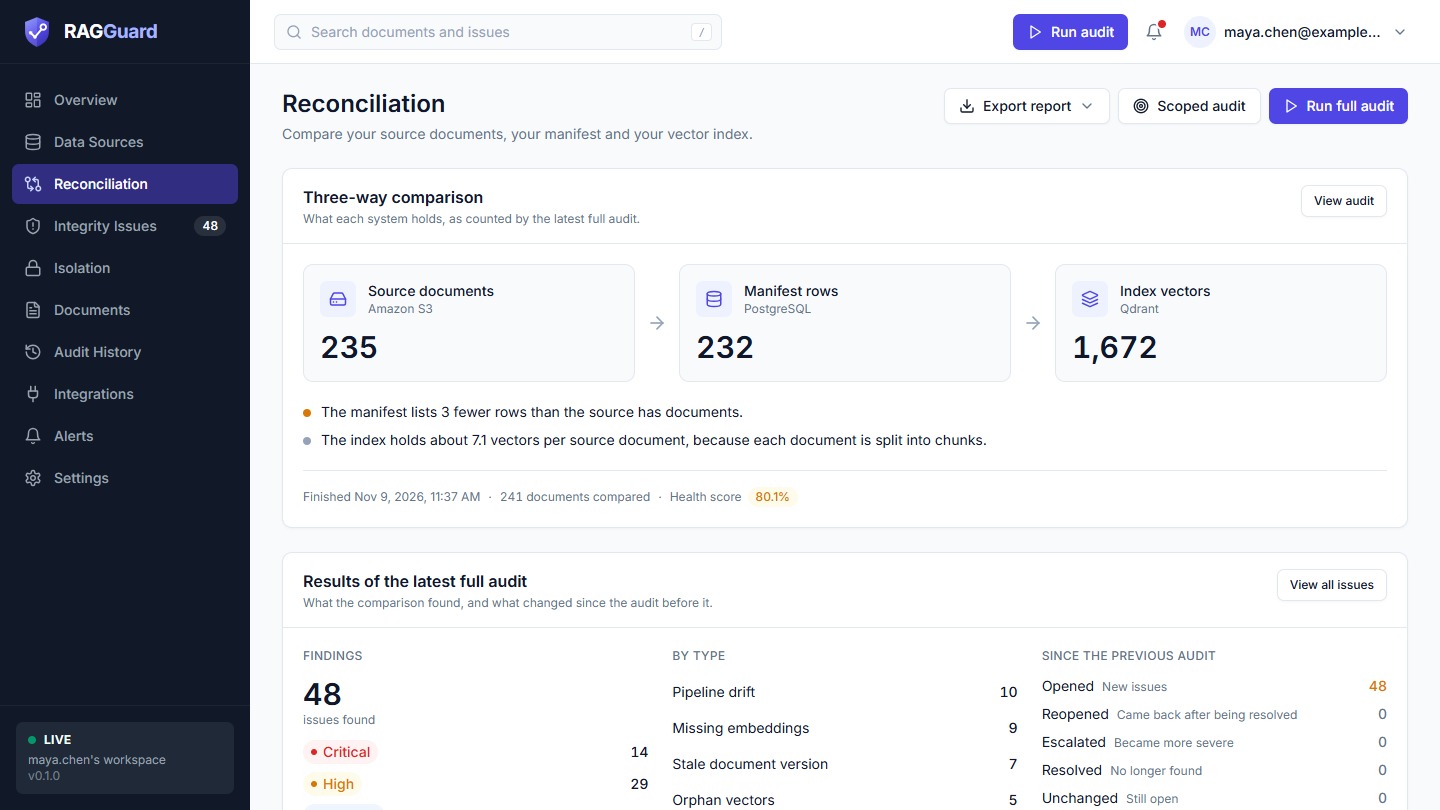
Reconciliation after the audit. The header holds Export report, Scoped audit and Run full audit.
If it did not work: if Run audit is dimmed, hover over it: the tooltip says "Connect your data sources first" or "An audit is already running". If the audit fails, open Audit history and read the error. See "'Run audit' is disabled" and "An audit stays running or fails" in Troubleshooting.
Step 5: Read the Overview
Open: Overview.
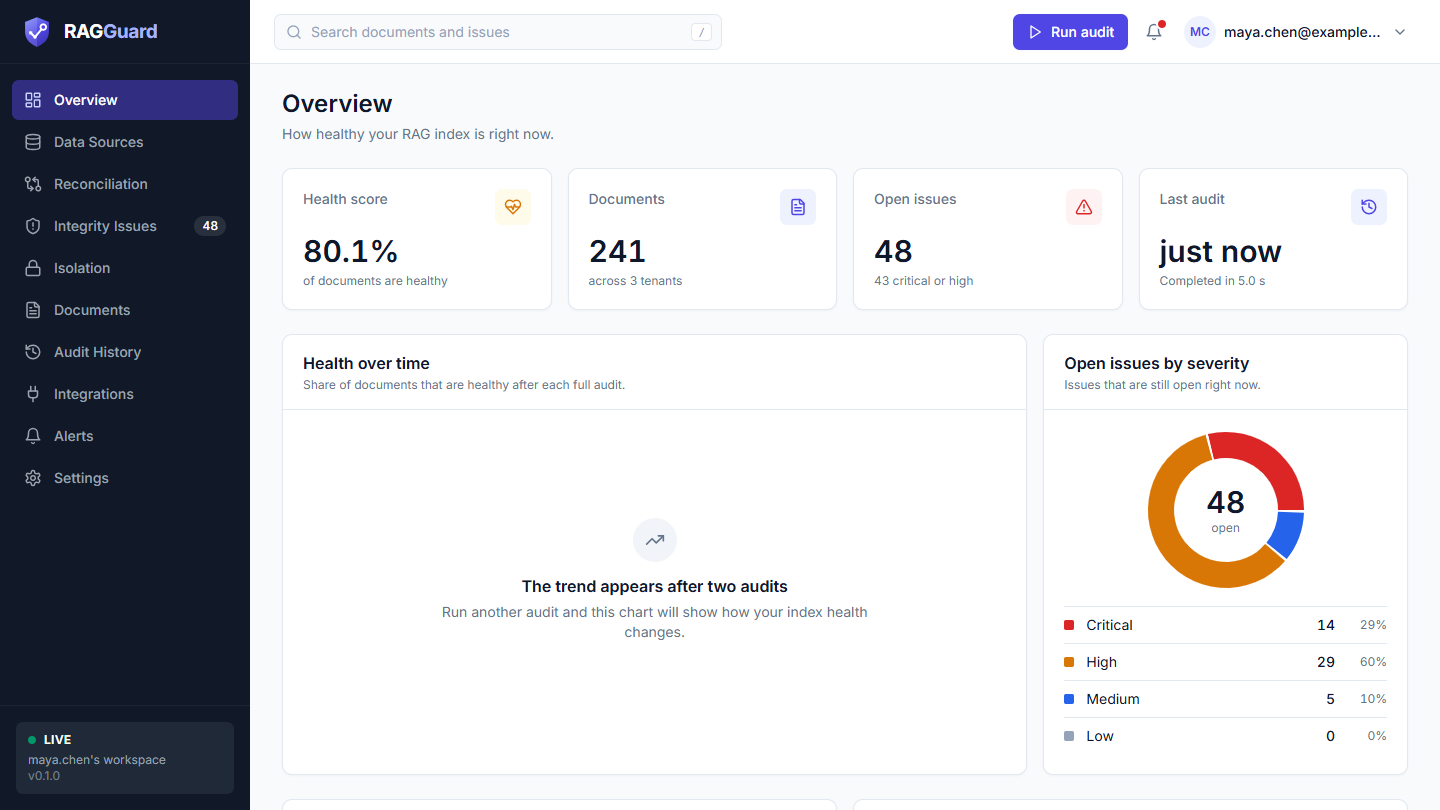
The top of Overview.
Read it from top to bottom:
- Health score: the share of documents that are healthy, as a percentage. The badge is green at 90% and above, amber from 70% up to just under 90%, and red below 70%. (Pending documents count as healthy, because they are probably still being ingested.)
- Documents: how many documents were compared, across how many tenants.
- Open issues: how many issues are open, and how many of those are critical or high. Click the card to open the list.
- Last audit: how long ago, and how long it took.
- Health over time: one point per completed full audit. It needs two audits before it draws a line ("The trend appears after two audits").
- Open issues by severity: a ring with a count per severity. Click a row to open the list filtered to that severity.
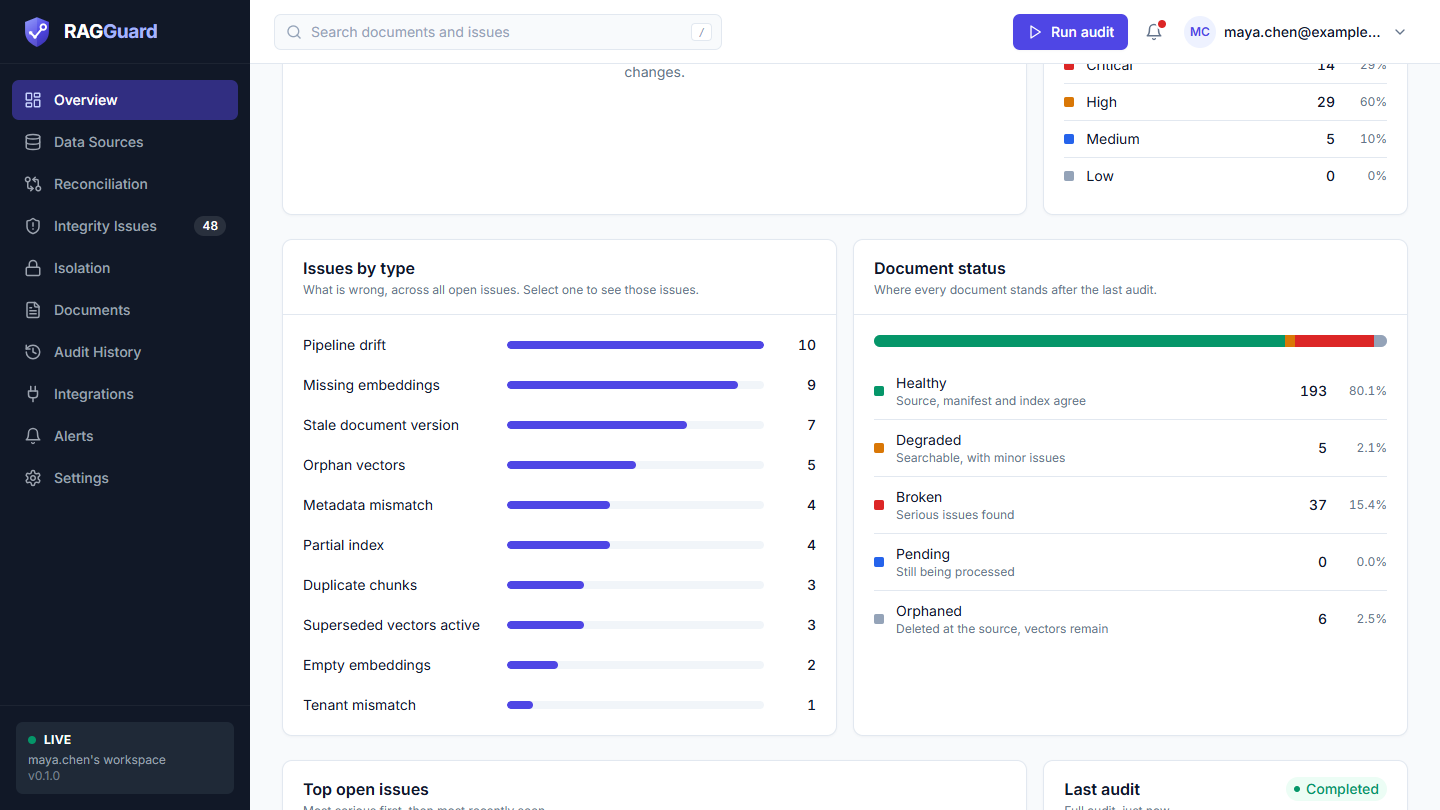
Issues by type and Document status.
- Issues by type: what is wrong, most common first. Click a bar to open those issues.
- Document status: Healthy, Degraded, Broken, Pending and Orphaned, each with a count and a share. Click a row to see those documents.
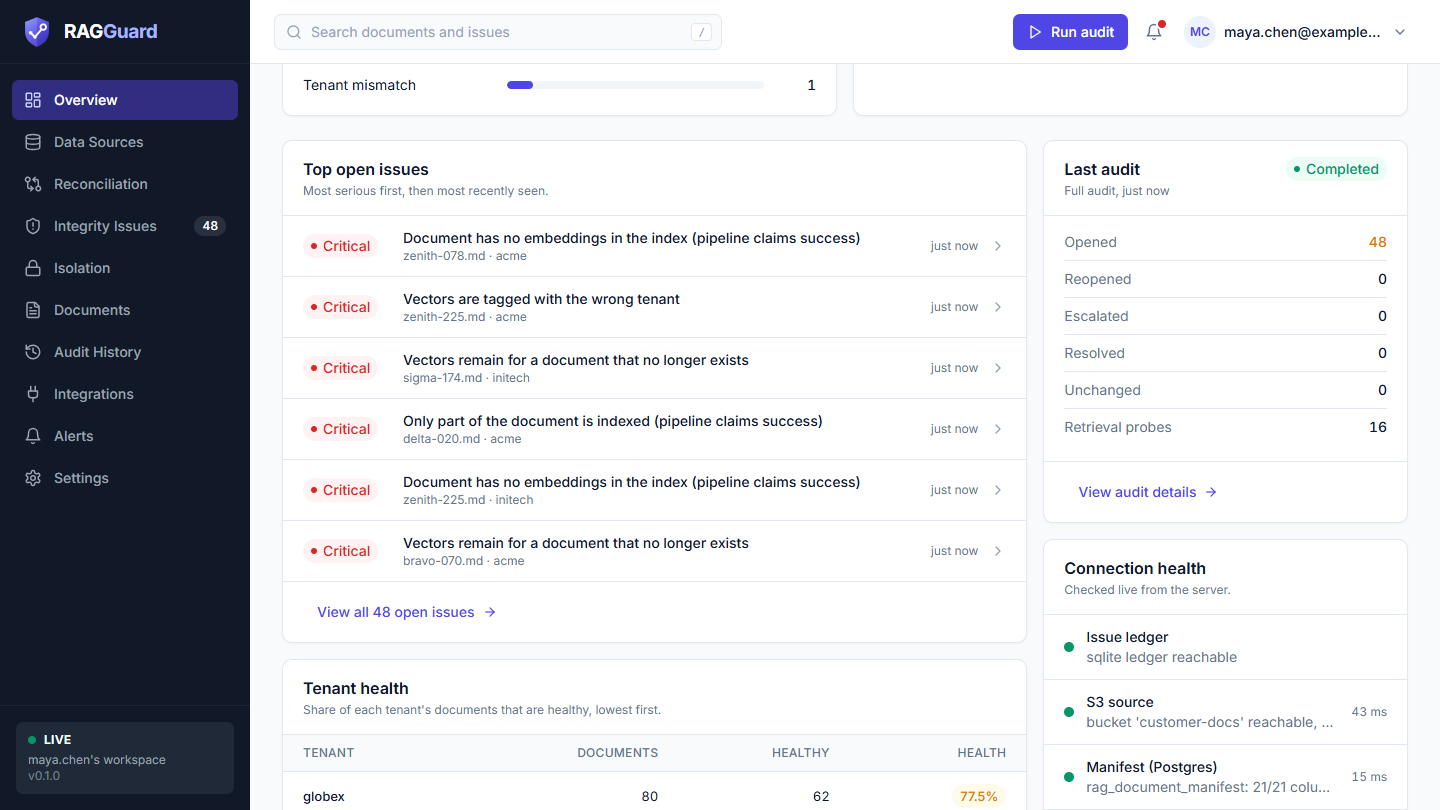
Top open issues, Last audit, Tenant health and Connection health.
- Top open issues: the six worst, most serious first.
- Last audit: counts of Opened, Reopened, Escalated, Resolved and Unchanged issues, and how many Retrieval probes ran.
- Tenant health: documents, healthy count and score per tenant, lowest first.
- Connection health: one line per system, checked live, with response time.
What good looks like: a green health score, "None critical or high" under Open issues, and four green dots under Connection health. A first audit of an existing system rarely looks this good, and that is normal: the point of the first audit is to learn where you stand.
If it did not work: if you see "No audit has run yet", go back to Step 4. If numbers look odd, see "Too many issues" and "Zero issues when you expect some" in Troubleshooting. Every card is explained in Overview.
Step 6: Read Reconciliation
Open: Reconciliation.
The three-way comparison, with the results of the latest full audit below it.
- Three-way comparison shows three counts from the latest full audit: Source documents (Amazon S3), Manifest rows (PostgreSQL) and Index vectors (Qdrant). Under them, plain sentences describe the real differences, for example that the manifest lists fewer rows than the source has documents, or that the index holds about so many vectors per source document (a vector is one chunk, so this number is normally above 1).
- Results of the latest full audit shows the number of findings, how many per severity, how many per type, and a Since the previous audit column (Opened, Reopened, Escalated, Resolved, Unchanged).
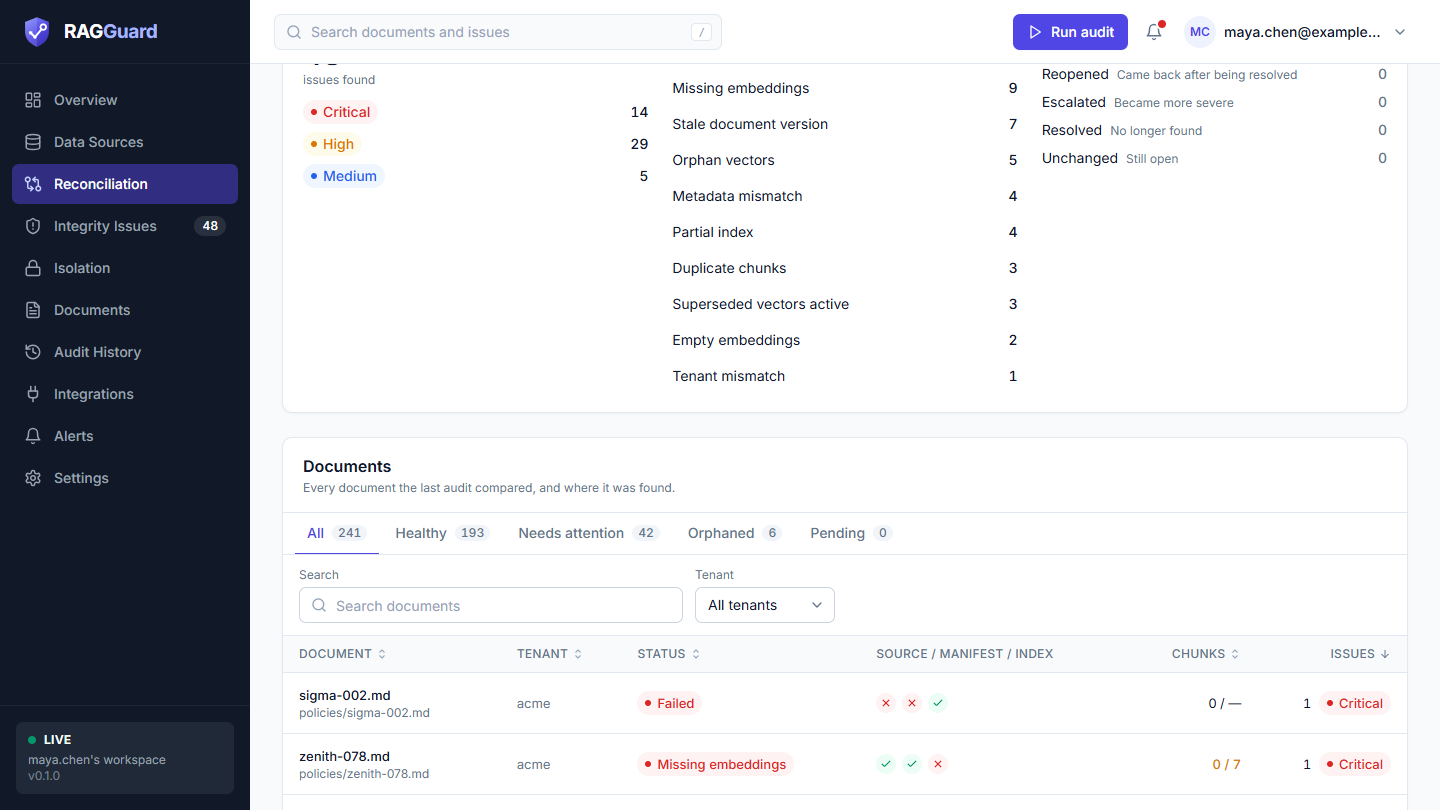
The Documents table. Tabs: All, Healthy, Needs attention, Orphaned, Pending.
- The Documents card lists every document the audit compared. The three small circles in Source / Manifest / Index show whether the document is present in each system: green tick for present, red cross for missing. A document with a red cross in the Source column but a green tick in Index is a deleted document whose vectors are still searchable.
- Chunks shows "indexed / expected". A figure in amber means they differ.
What good looks like: the manifest row count is close to the source document count, every document has green ticks in all three circles, and indexed chunks match expected chunks.
If it did not work: if "Source documents" is 0 although your bucket has files, your Key prefix or Key pattern is wrong. See "Documents shown as Failed, Missing or orphaned unexpectedly" in Troubleshooting. Detail is in Reconciliation.
Step 7: Triage the issues
Open: Integrity issues in the left menu (the number next to it is the count of open issues). The Issues tab is selected.
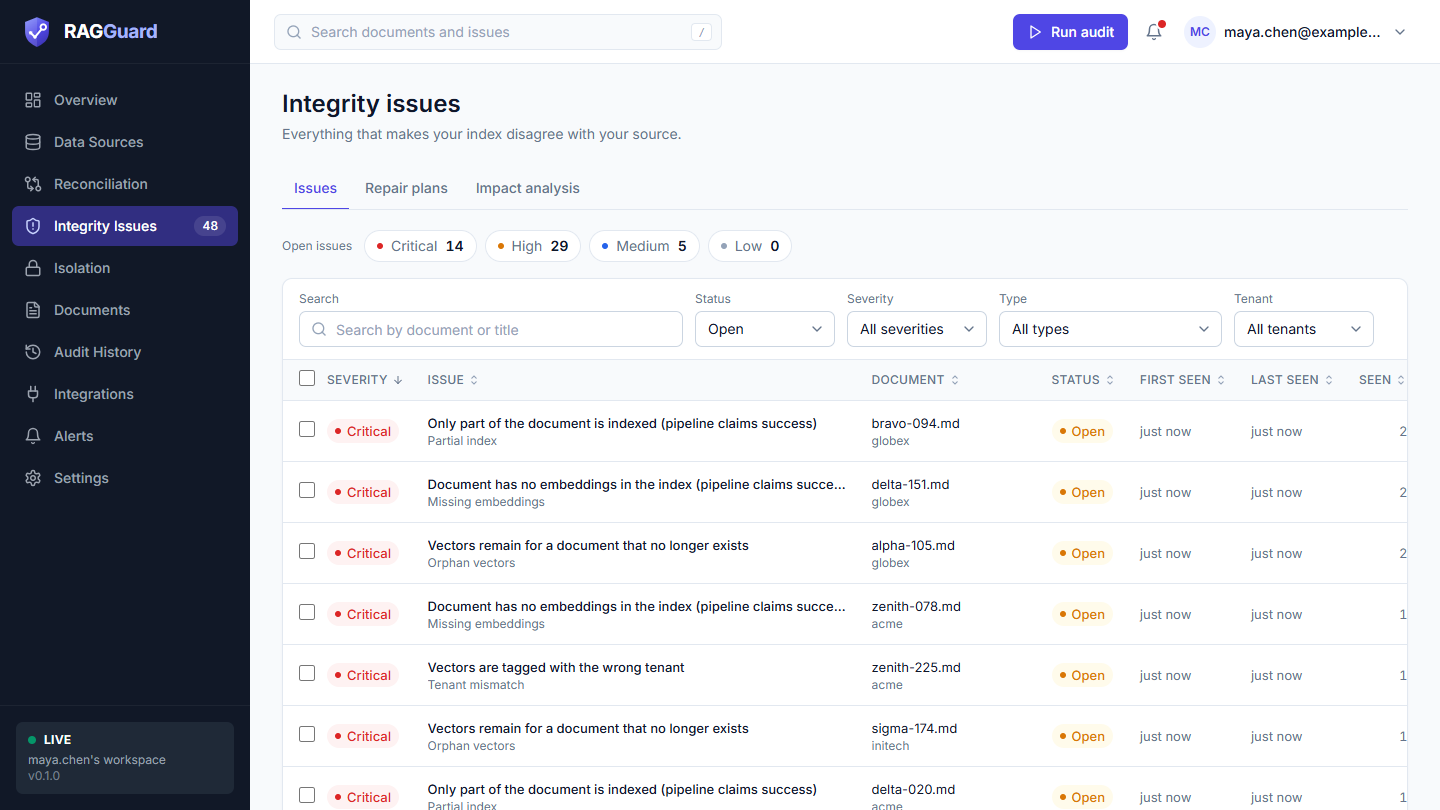
The Issues list.
Do:
- Click the Critical chip above the table. The table shows only open critical issues. (Click the chip again to clear it.)
- Read the columns: Severity, Issue, Document, Status, First seen, Last seen and Seen (how many audits have seen it).
- Click a row. A panel opens on the right.
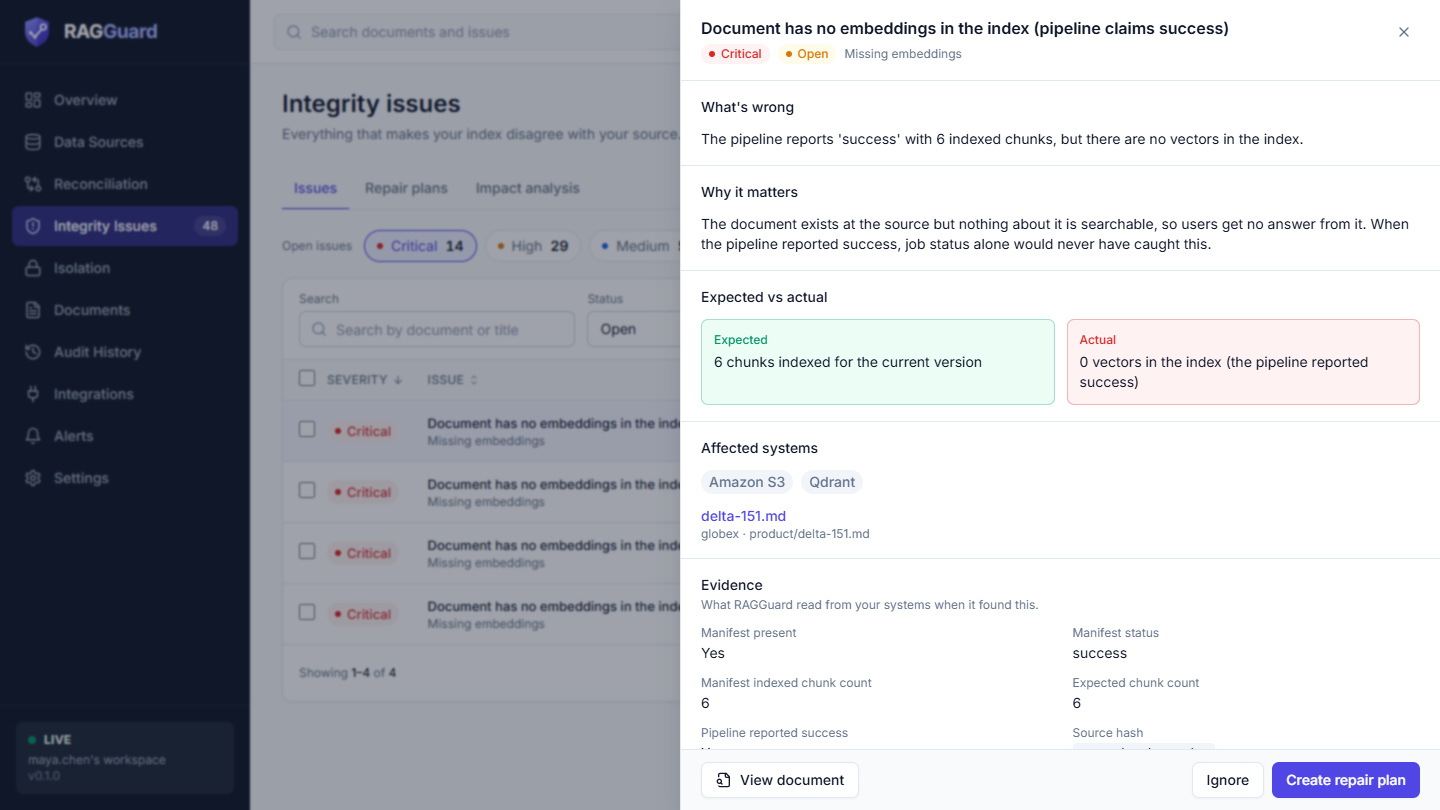
The top of the issue panel.
In the panel, work downward:
- What's wrong: the plain-language description.
- Why it matters: what this means for your users.
- Expected vs actual: two boxes, green for what should be true and red for what is.
- Affected systems: which of Amazon S3, PostgreSQL and Qdrant are involved, with a link to the document.
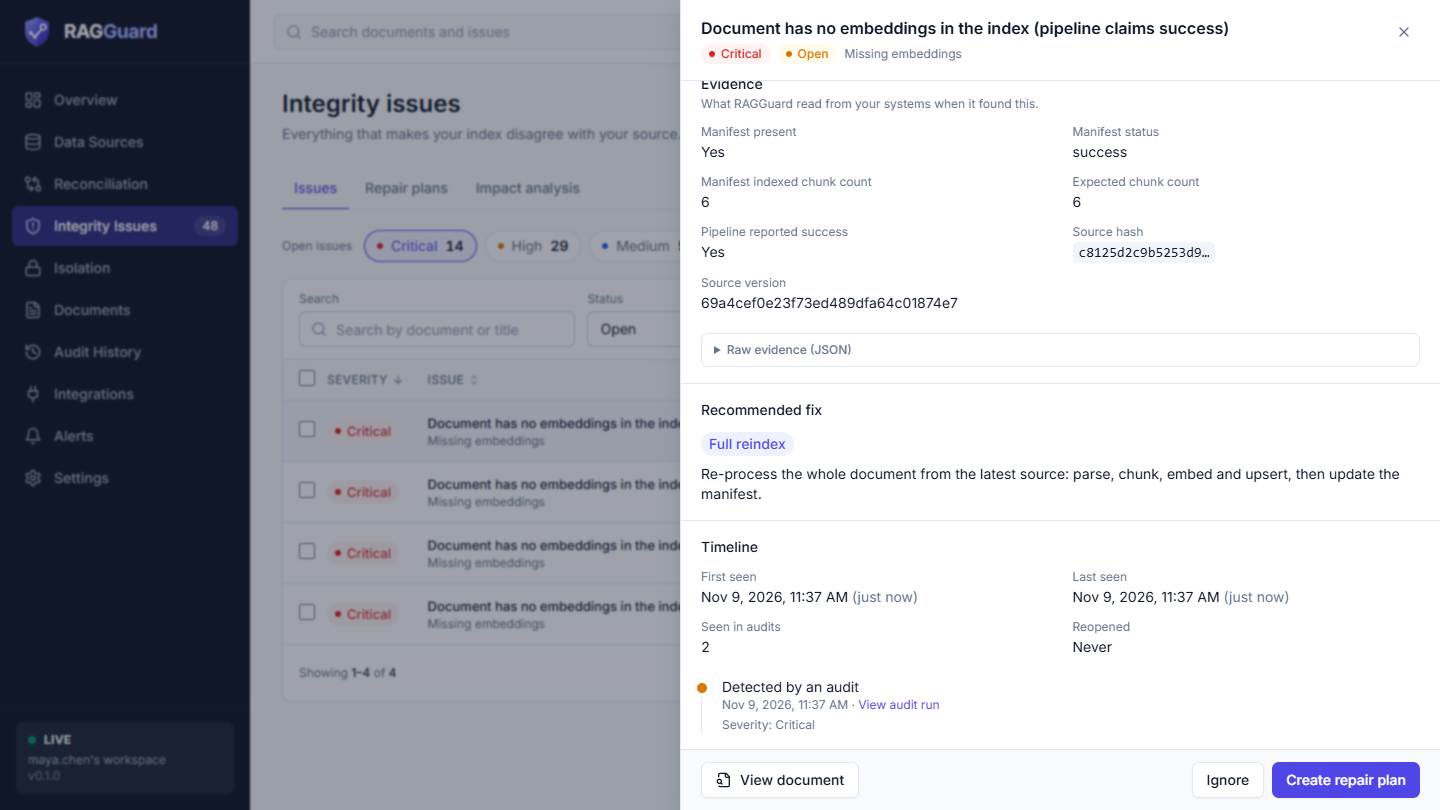
Evidence, Recommended fix and Timeline.
- Evidence: what RAGGuard read from your systems. A Retrieval probe shows whether the bad content can really be returned by a search, at what rank and with what score. A probe that confirms it escalates the severity of orphan and superseded-vector issues. Raw evidence (JSON) opens the full data.
- Recommended fix: one of Full reindex, Re-embed missing chunks, Remove old vectors, Fix metadata or Needs a human.
- Timeline: when it was first seen, last seen and what happened to it.
What good looks like: for each critical issue you can answer three questions: is it real, what does it affect, and what would fix it. The most dangerous ones are those where the pipeline reported success but the index disagrees (the title says "pipeline claims success"), and a tenant mismatch (vectors tagged with the wrong tenant, which is a leak risk).
If it did not work: if the list is empty but you expect issues, see "Zero issues when you expect some" in Troubleshooting. Every part of this page is explained in Integrity issues; the meaning of each issue type is in the Reference.
Step 8: Ignore a false alarm with a reason
Some issues are real findings that you have decided to accept: a document that is being retired, a known test file, a deliberate difference.
Open: the issue panel of an issue you have decided to accept.
Do:
- Click Ignore. A dialog asks "Ignore this issue?".
- Type a Reason (optional), for example "expected, this document is being retired". It is saved in the issue history and can be up to 500 characters.
- Click Ignore issue.
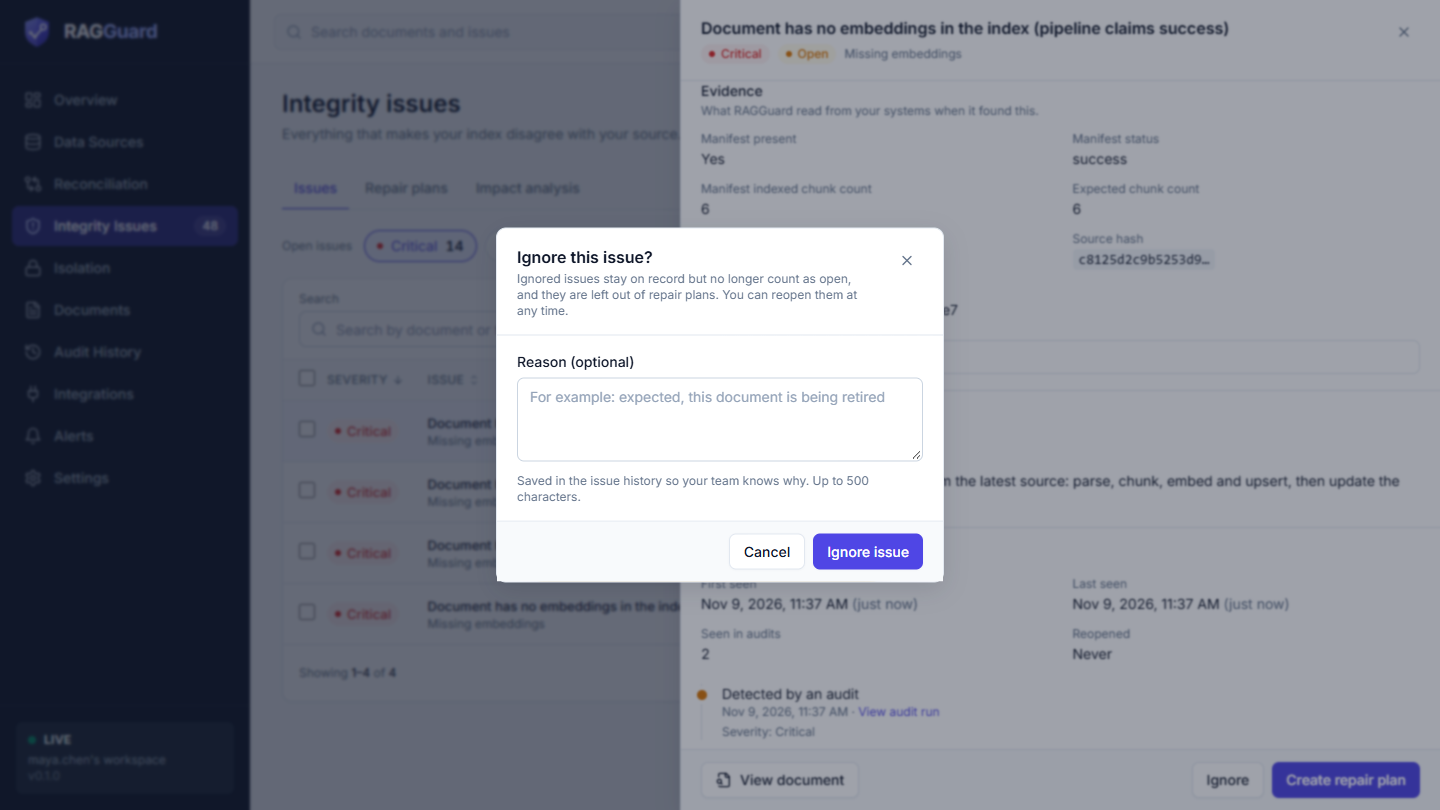
The Ignore dialog.
To ignore several at once, tick their rows in the list; a bar appears with Create repair plan, Ignore and Clear selection.
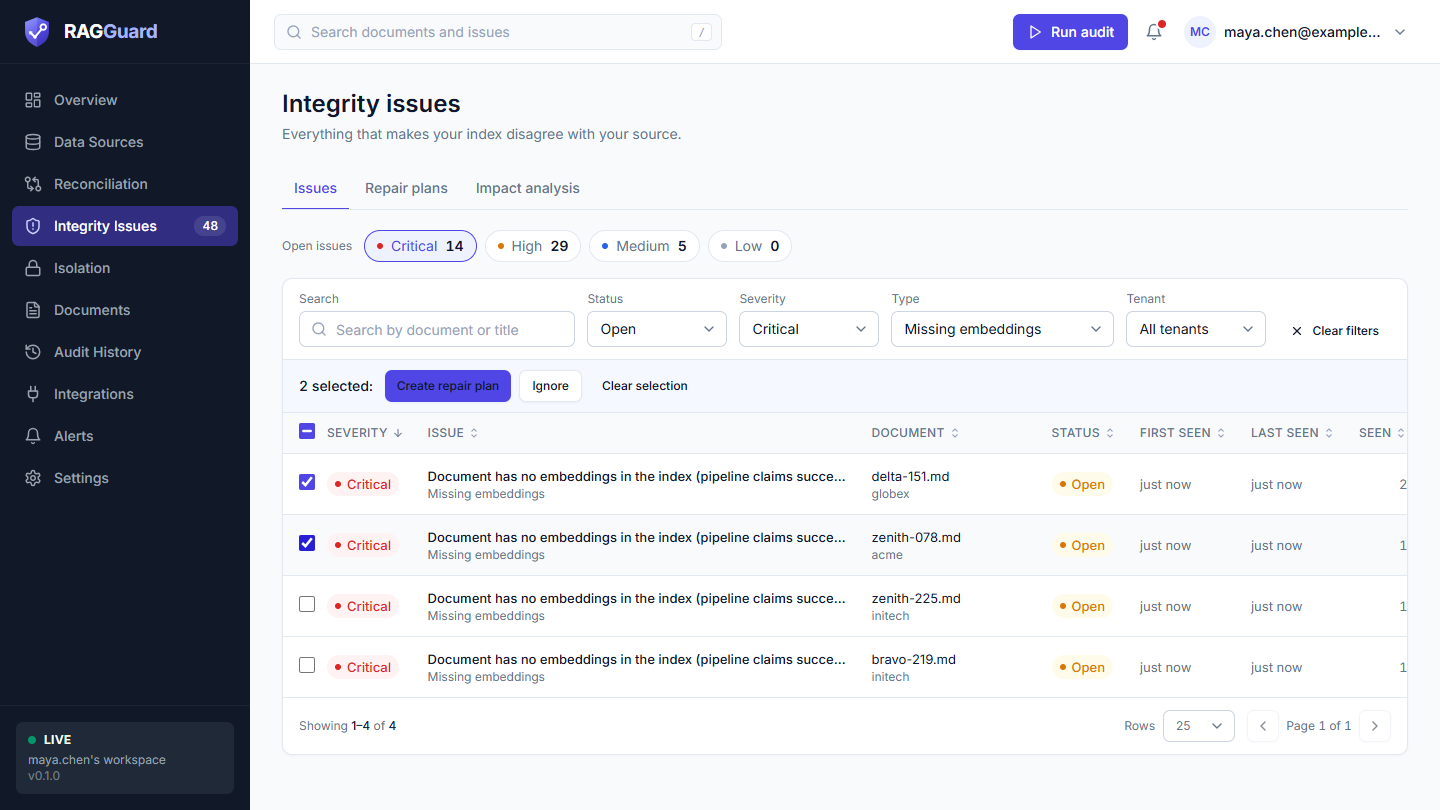
Rows ticked, with the bulk action bar.
You should see: a toast "Issue ignored". The issue leaves the default list (which shows Open issues). Set the Status filter to Ignored to see it again, with "Ignored because" and your reason in its Timeline. To bring it back, open it and click Reopen.
What good looks like: the open count and the severity counts drop by one. Ignored issues stay on record, are left out of repair plans, and stay ignored even if later audits still find the same problem.
Good to know: ignoring changes the issue list, not the judgement of the document. The document is still graded by what the audit finds, so ignoring does not change the health score.
If it did not work: if the list does not change, see "The page is not updating" in Troubleshooting. If an ignored issue seems to have come back, check the Status filter: it is probably still there as Ignored. More in Integrity issues.
Step 9: Create a repair plan
A repair plan groups the open issues of each document into the smallest safe action, and estimates the work and cost.
Open: Integrity issues, Repair plans tab.
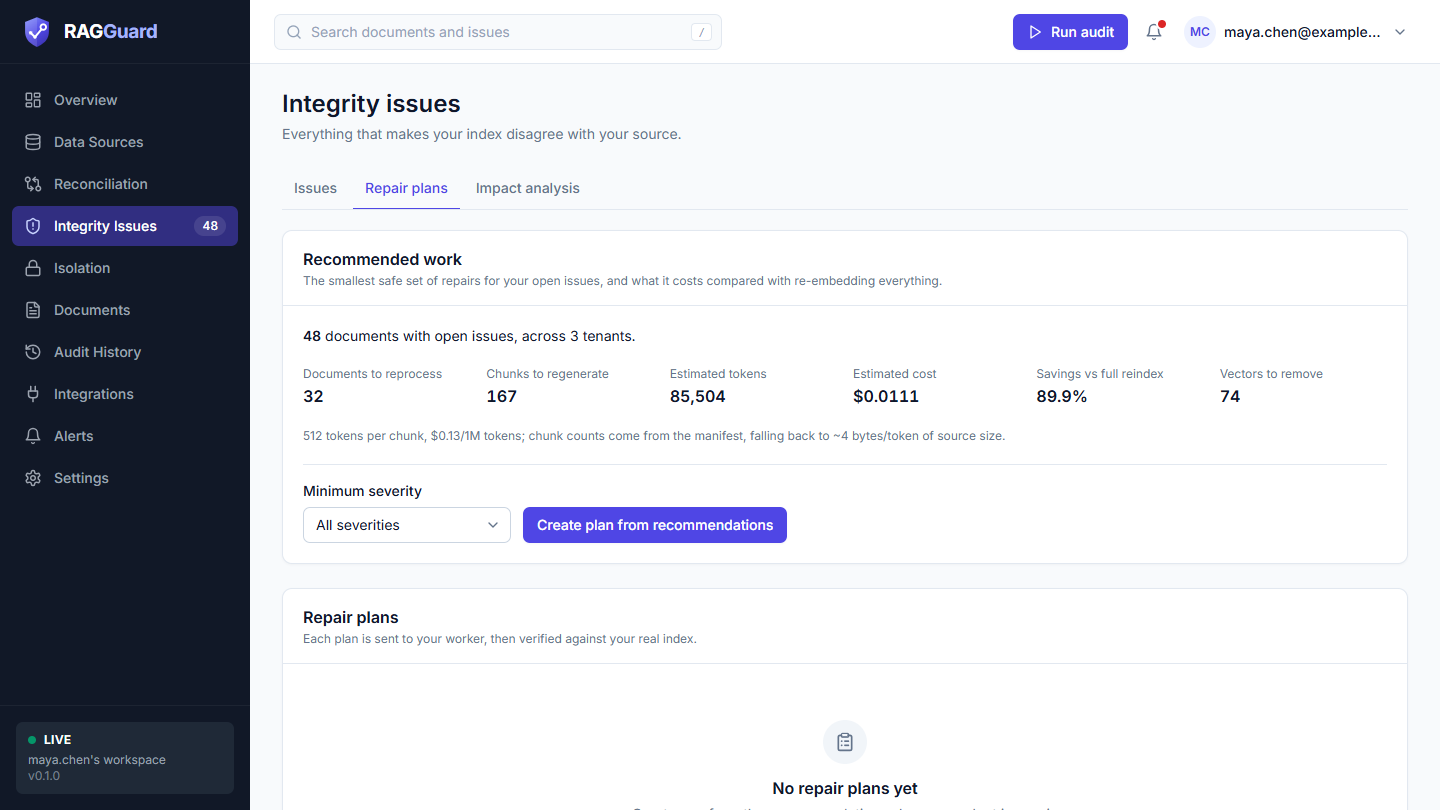
The Recommended work card and the plans table.
Do: use any one of these three ways.
- In the Recommended work card, optionally choose a Minimum severity ("All severities", "Critical and above", "High and above", and so on), then click Create plan from recommendations.
- In the Issues tab, tick rows and click Create repair plan.
- In one issue's panel, click Create repair plan.
You should see: a toast "Repair plan created" with the number of documents, and a panel opens for the new plan with its status Draft.
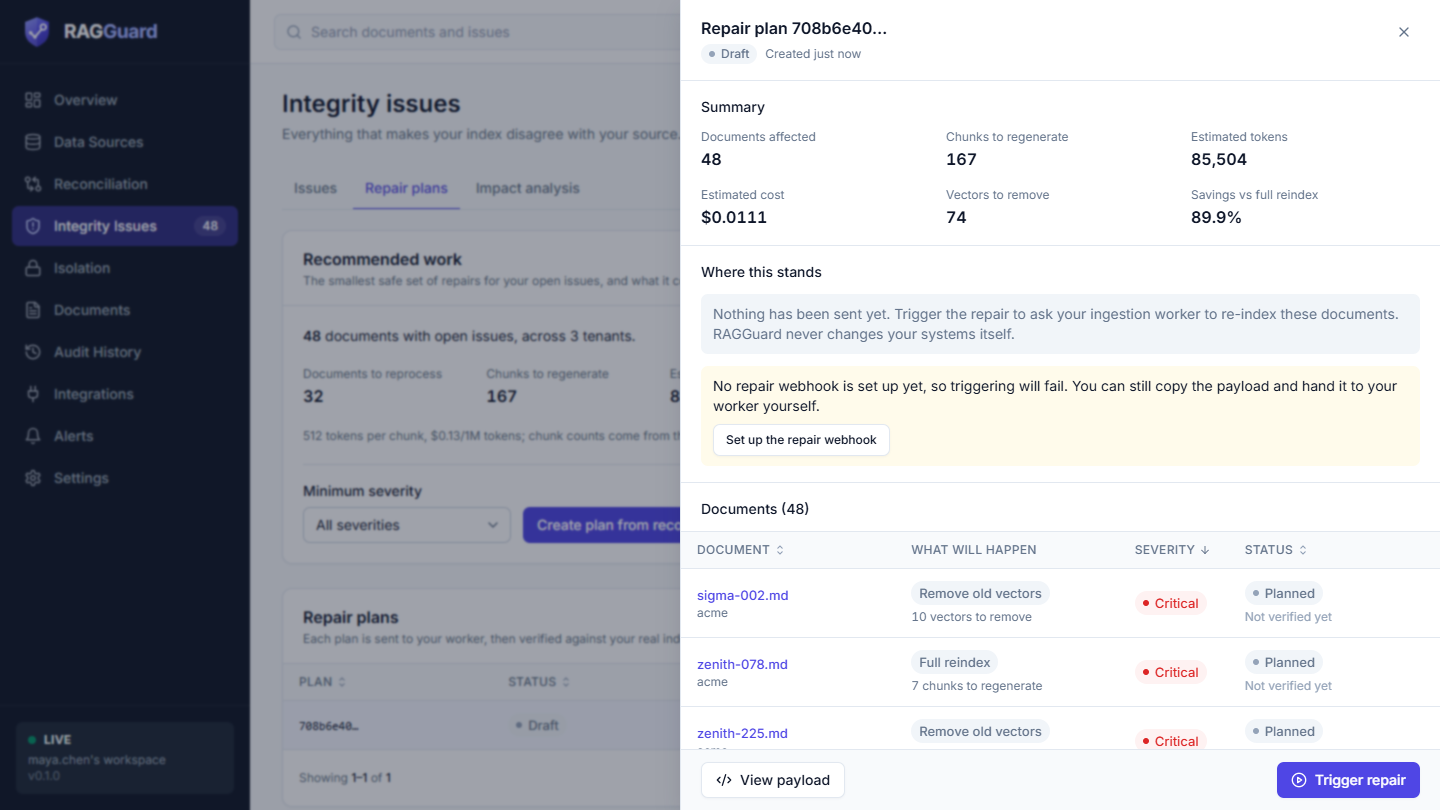
A Draft plan. Summary figures first, then "Where this stands", then the documents.
Read the panel:
- Summary: Documents affected, Chunks to regenerate, Estimated tokens, Estimated cost, Vectors to remove and, when it can be computed, Savings vs full reindex.
- Where this stands: for a Draft it says nothing has been sent yet. If no webhook is set up, an amber note says so, with a Set up the repair webhook button.
- Documents: one row per document with What will happen (badges such as Full reindex, Re-embed missing chunks, Fix metadata, Remove old vectors, Needs a human), Severity and Status (Planned).
- History: what has happened to the plan.
What good looks like: the plan lists exactly the documents you meant, with the smallest action for each (for example a document with only missing chunks gets Re-embed missing chunks, not a full reindex).
If it did not work: the message "No open document-level issues match that selection." means there is nothing to plan: collection-wide issues ("Whole collection") cannot become repair plans. See "Plan creation" under "Repair problems" in Troubleshooting. The page is explained in Repair plans.
Step 10: Set up the repair webhook
A repair plan is carried out by your worker. RAGGuard sends it a signed request (a webhook), and the worker re-reads the latest source, re-processes the documents, and writes the new vectors and manifest rows.
Open: Integrations in the left menu. The first card is Repair webhook.
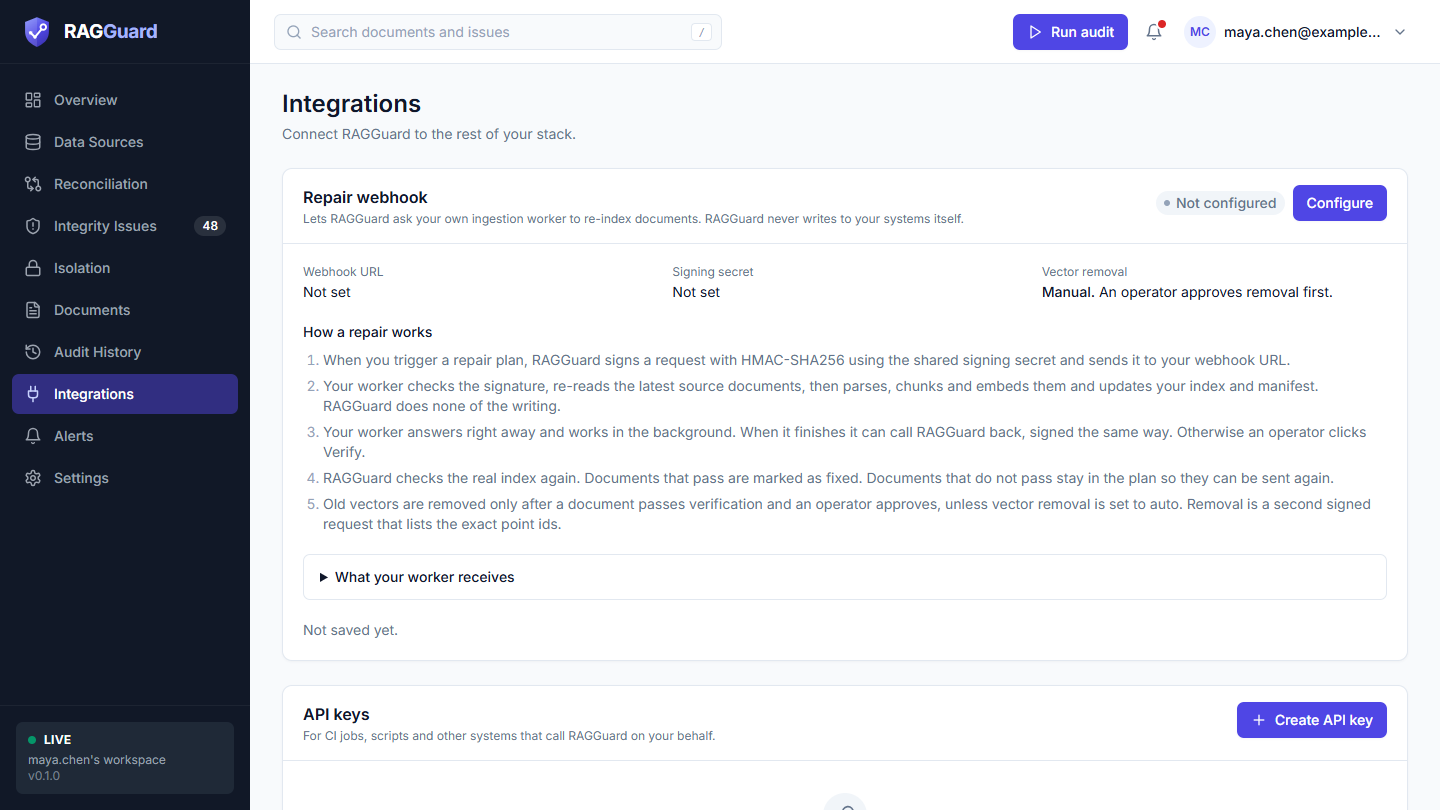
The Repair webhook card, with the five-step explanation of how a repair works.
Do:
- Click Configure (or Edit).
- In the dialog, enter the Webhook URL your worker listens on (it must be a public address, for example
https://worker.example.com/ragi-webhook). - Enter a Signing secret: a long random string that you also give to your worker. It is required before anything is sent.
- Leave Vector removal on its default, which is manual: an operator approves before old vectors are removed. (Automatic removes them right after verification passes.)
- Click Check settings. This only checks that the values are valid and the address is allowed; it sends nothing to your worker.
- Click Save.
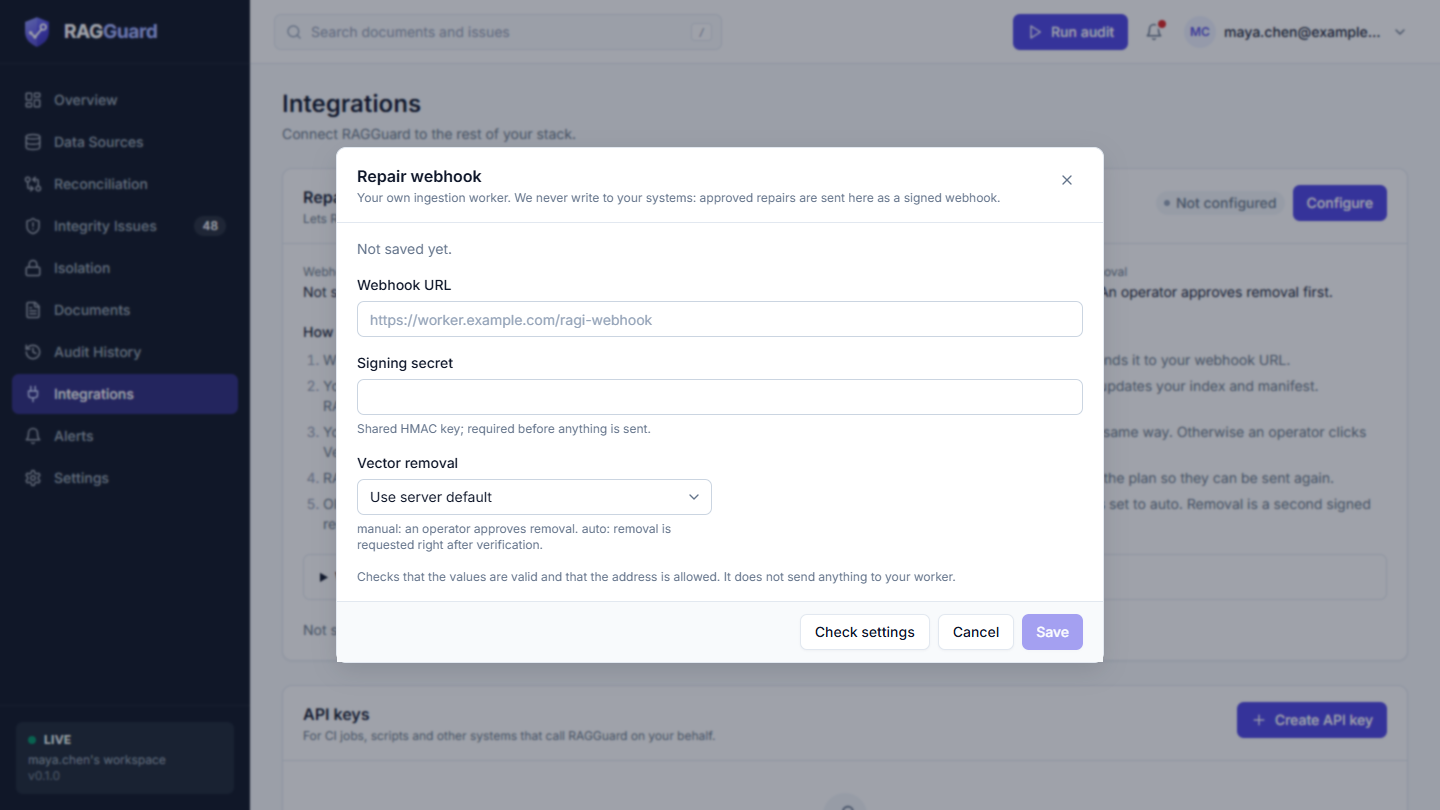
The repair webhook dialog.
Your worker must verify the signature (HMAC-SHA256 over the timestamp, a dot and the raw request body), answer with a 2xx status quickly, and do its work in the background. The exact headers and body are listed under What your worker receives on the card, in Integrations, and in docs/repair-webhook.md (see ../repair-webhook.md).
You should see: the badge on the card changes to Configured, the Webhook URL is shown, Signing secret says "Saved", and Vector removal says "Manual. An operator approves removal first."
What good looks like: open a Draft plan again. The amber "No repair webhook is set up yet" note is gone.
If you have no worker yet: you can still use View payload in a plan to copy the exact request and hand it to your worker yourself. Without a webhook the plan cannot move past Draft, so afterwards run a new audit (Step 14) to see the result.
If it did not work: see "Repair problems" in Troubleshooting.
Step 11: Trigger the repair
Open: Integrity issues, Repair plans tab, click your Draft plan.
Do:
- Optional: click View payload to see the exact signed body that will be sent (event
repair.requested, phasereindex, the plan id, a safety note, the target pipeline and the list of documents with their actions). Copy JSON copies it. Click Hide payload to close it. - Click Trigger repair.
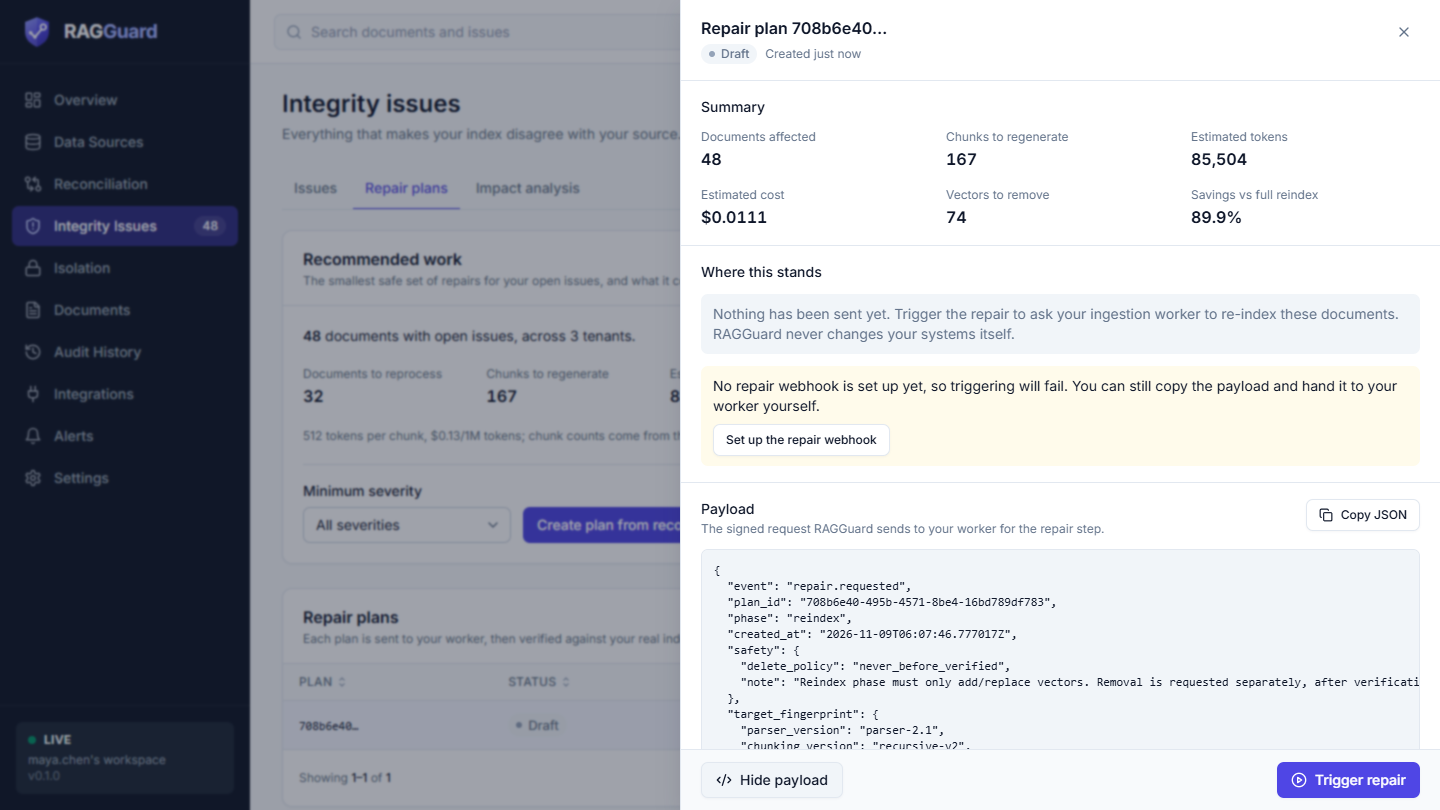
View payload shows what your worker receives.
You should see: a toast "Repair sent to your worker" with "N document(s) to reprocess. Verify once your worker has finished." The plan status changes to Triggered, and History gains "Repair sent to your worker". This phase only adds or replaces vectors. It never deletes anything.
What good looks like: status Triggered, and your worker's log shows a signed POST that it accepted. If your worker calls RAGGuard back when it finishes, you will also see "Your worker reported back" in History, and Step 12 happens automatically.
If it did not work: if the toast says "Couldn't send the repair", read its text. "No repair webhook configured..." means Step 10 is not done. "Repair webhook delivery failed..." means your worker's address did not answer with a 2xx status. A Draft plan stays Draft after a failed send. See "Repair problems" in Troubleshooting.
Step 12: Verify
RAGGuard never trusts a worker's word that it finished. It re-checks the real index.
Open: the same plan panel.
Do: wait until your worker says it has finished, then click Verify now. (If your worker called back, this has already run.)
You should see: RAGGuard runs a verification audit of just the plan's documents (it appears in Audit history with Type Verify). A toast reports one of three outcomes:
| Toast | Meaning |
|---|---|
| "Verified" with "Every repair is in place." | The plan is Completed. |
| "Replacements verified" with "The old vectors are waiting for your approval." | The plan is Cleanup pending: new vectors are in place, old ones remain. |
| "Verified: not everything is fixed yet" with "Some documents still have issues." | The plan is Partial or Failed. |
Each document row now shows a status and a checklist of five checks:
| Check | Passes when |
|---|---|
| All chunks present | No missing-embedding or partial-index issue remains |
| Embeddings present | No missing or empty embedding remains |
| Latest version indexed | No stale-embedding issue remains |
| Metadata correct | No metadata or pipeline-drift issue remains |
| Old vectors removed | No superseded, duplicate, orphan or tenant-mismatch vectors remain |
A document where the first four pass is Replacements verified (or Waiting for cleanup, if the document needs only removal of vectors and no re-indexing). A document where all five pass is Completed. A document that fails any of the first four is Not fixed yet, with a line "Still found: ..." naming what remains. A worker that reports success but wrote only half the chunks is caught here.
What good looks like: documents show Replacements verified or Completed, and the plan shows Cleanup pending or Completed.
If it did not work: for Not fixed yet documents, fix the cause in your worker and click Send repair again (only the failed documents are sent), then Verify now. See "Verification" under "Repair problems" in Troubleshooting.
Step 13: Approve the cleanup
After a document is re-indexed, its old vectors still exist next to the new ones. They can still answer queries, so they must be removed, but removal cannot be undone, so RAGGuard asks for your explicit approval.
Open: the plan panel, with status Cleanup pending.
Do:
- Click Approve cleanup (the red button).
- Read the confirmation, "Remove N old vectors?" and "This cannot be undone." The number shown is the plan's estimate. The exact list is read again from your live index at the moment you confirm, and only for documents that passed verification, so the real number can differ. The plan's History entry "Cleanup sent to your worker" shows the number actually sent.
- Click Remove N vectors.
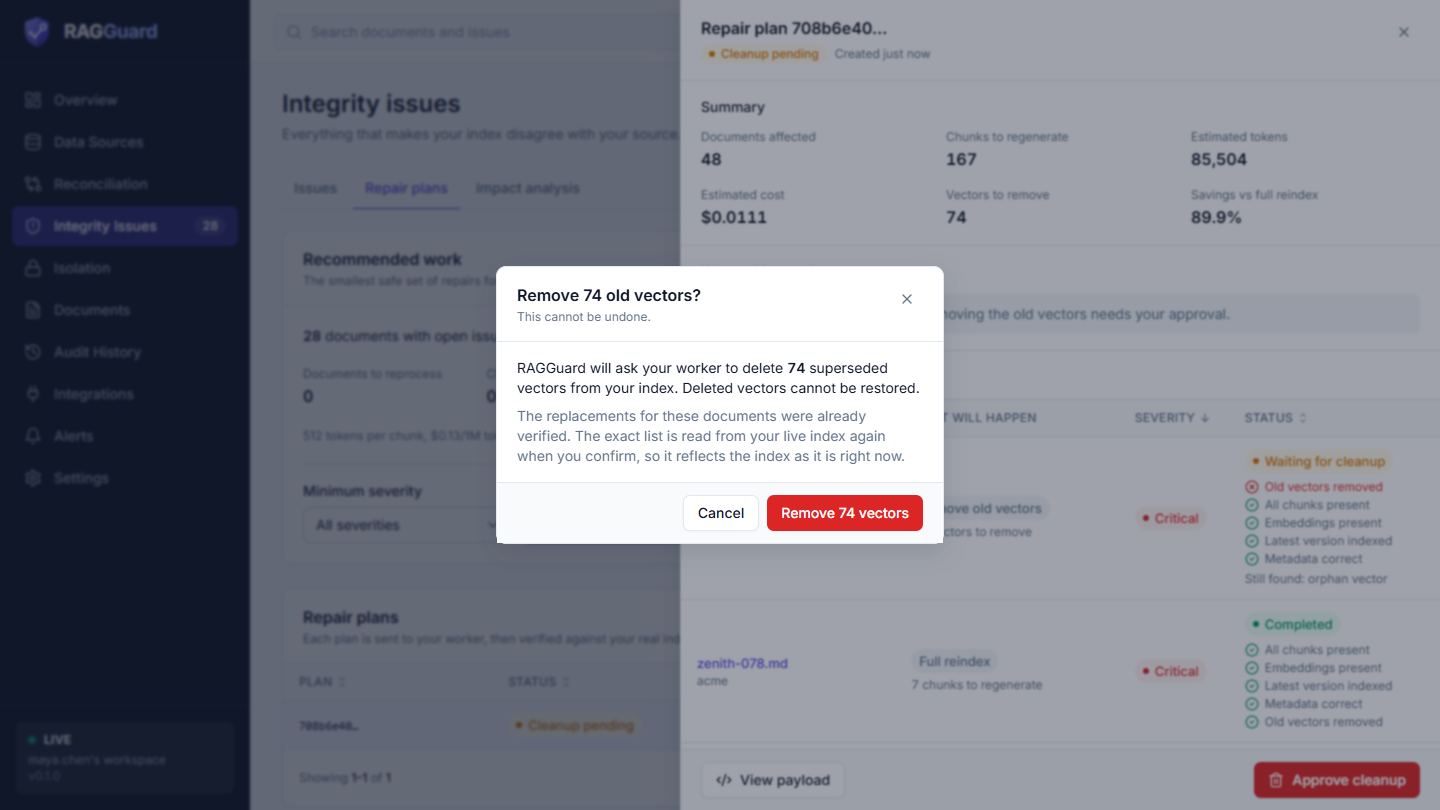
The confirmation. RAGGuard asks your worker to delete the exact point ids; it deletes nothing itself.
You should see: a toast "Cleanup sent to your worker". The plan status changes to Cleanup triggered. Now click Verify now once more. If your worker deleted the vectors, the "Old vectors removed" check passes and the plan becomes Completed.
What good looks like: plan status Completed (green badge), and "Every repair is verified. The index matches the source for each document in this plan."
Good to know: if you chose Automatic under Vector removal, this step happens by itself right after a successful verification. A plan that contains only removal work (for example only orphan vectors) has a known limit in this version, described in "Cleanup not offered" in Troubleshooting.
If it did not work: see "Cleanup not offered" in Troubleshooting.
Step 14: Run the audit again
Open: Reconciliation, click Run full audit.
You should see: a toast "Audit complete". Then check three places.
Overview after the second full audit: the health score is higher and the trend chart now draws a line.
- Overview: the Health score has improved, Open issues has fallen, and Health over time now shows two or more points. The score card can already have improved after Step 12, because the verification audit refreshes the documents it covers. The chart only adds a point after a full audit.
- Audit history: a new row for the full audit.
- Open that run for its details.
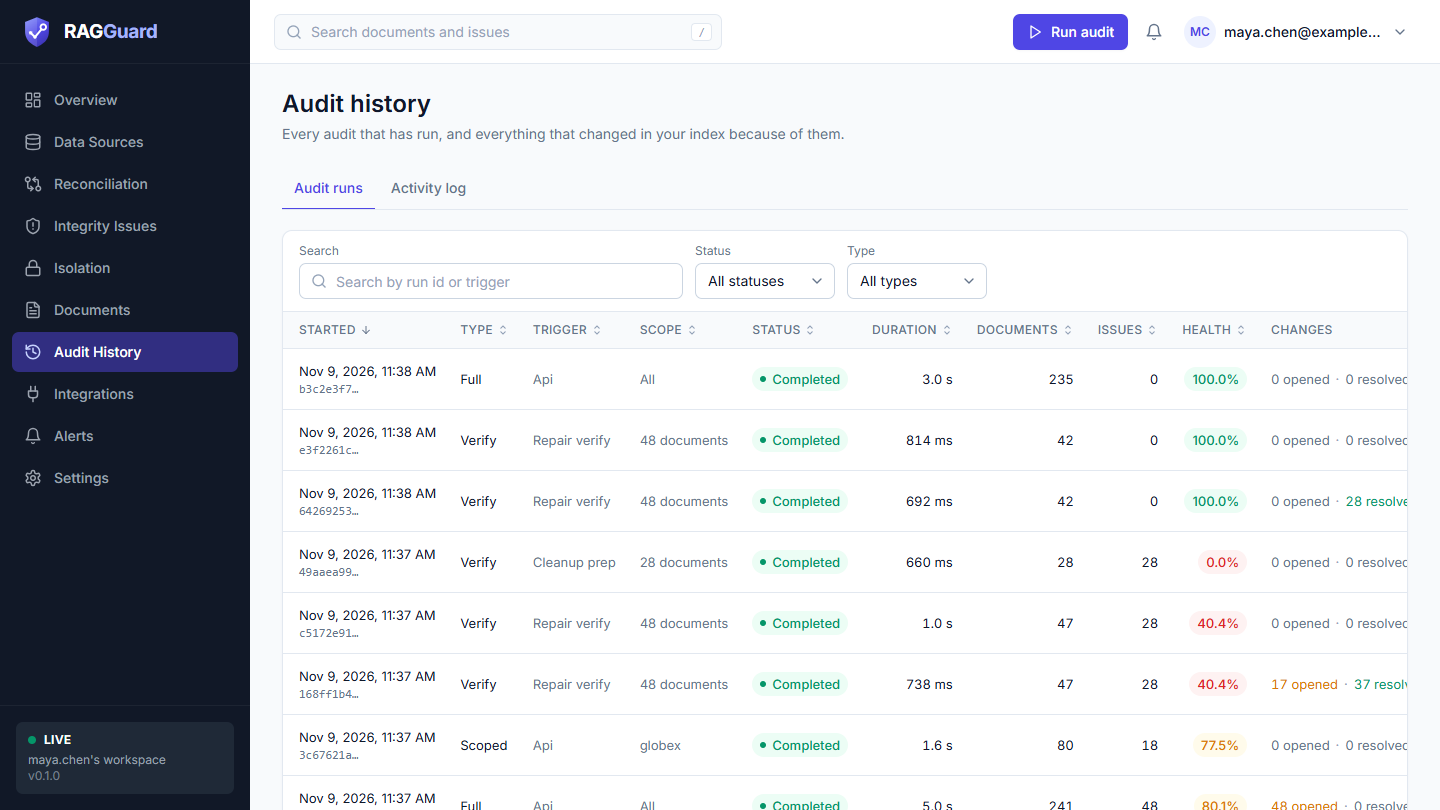
Audit runs, newest first. Columns: Started, Type, Trigger, Scope, Status, Duration, Documents, Issues, Health, Changes.
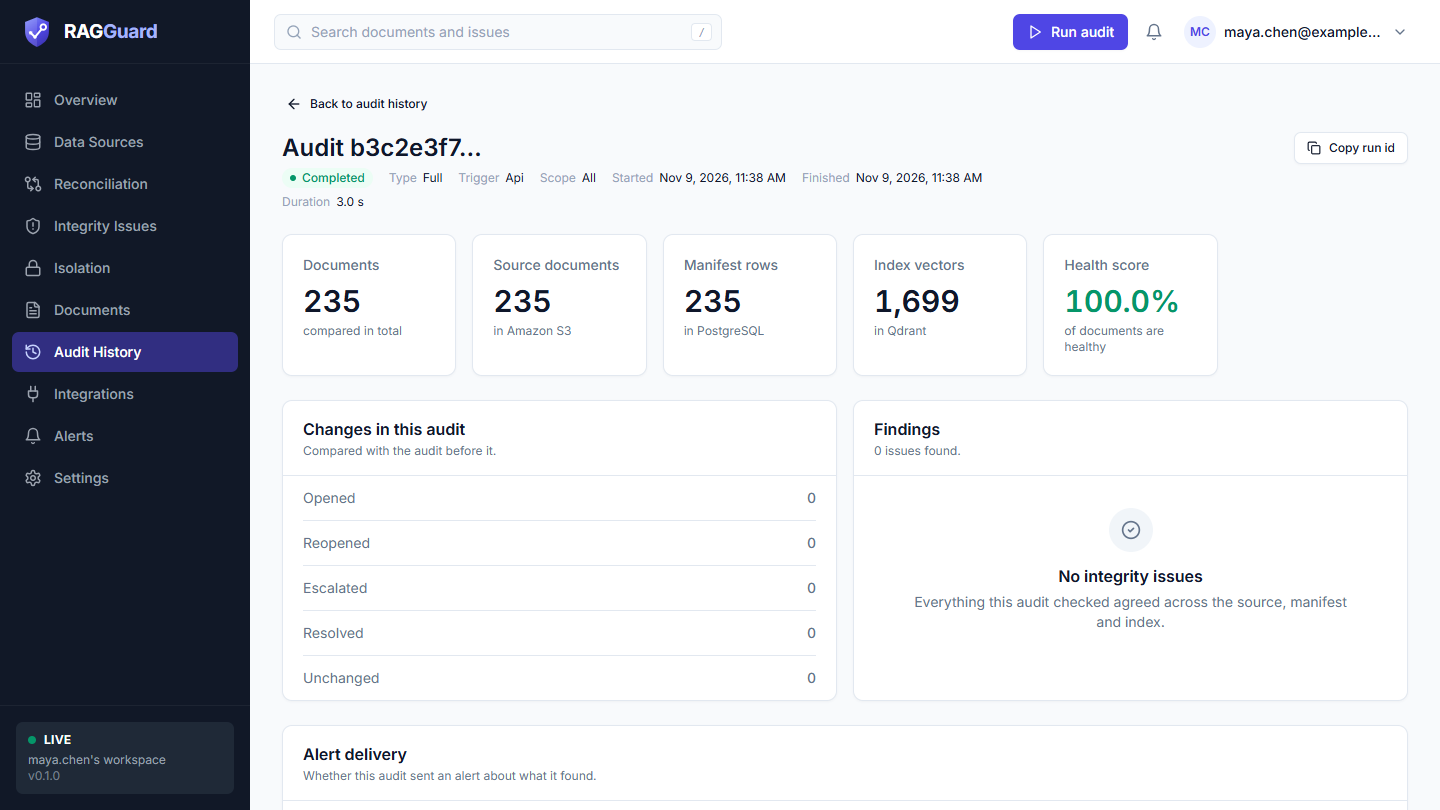
A single run. "Changes in this audit" counts Opened, Reopened, Escalated, Resolved and Unchanged.
The issues you fixed show Resolved in the Issues list (set Status to Resolved), and each one's Timeline says "Resolved: the index now matches the source." Issues in the plan's documents were already marked Resolved by the verification audit in Step 12, so the full audit's Resolved counter only counts what this run itself closed. What this audit adds is proof for the whole index.
What good looks like: a higher health score than before the repair, fewer open issues, and no new issues opened by the repair. If new issues appeared, a "Reopened" count means a problem came back.
If it did not work: see "Too many issues" and "Zero issues when you expect some" in Troubleshooting. Run details are in Audit history.
Step 15: Set up alerts
Repairs are reactive. Alerts tell you when something new breaks.
Open: Alerts in the left menu.
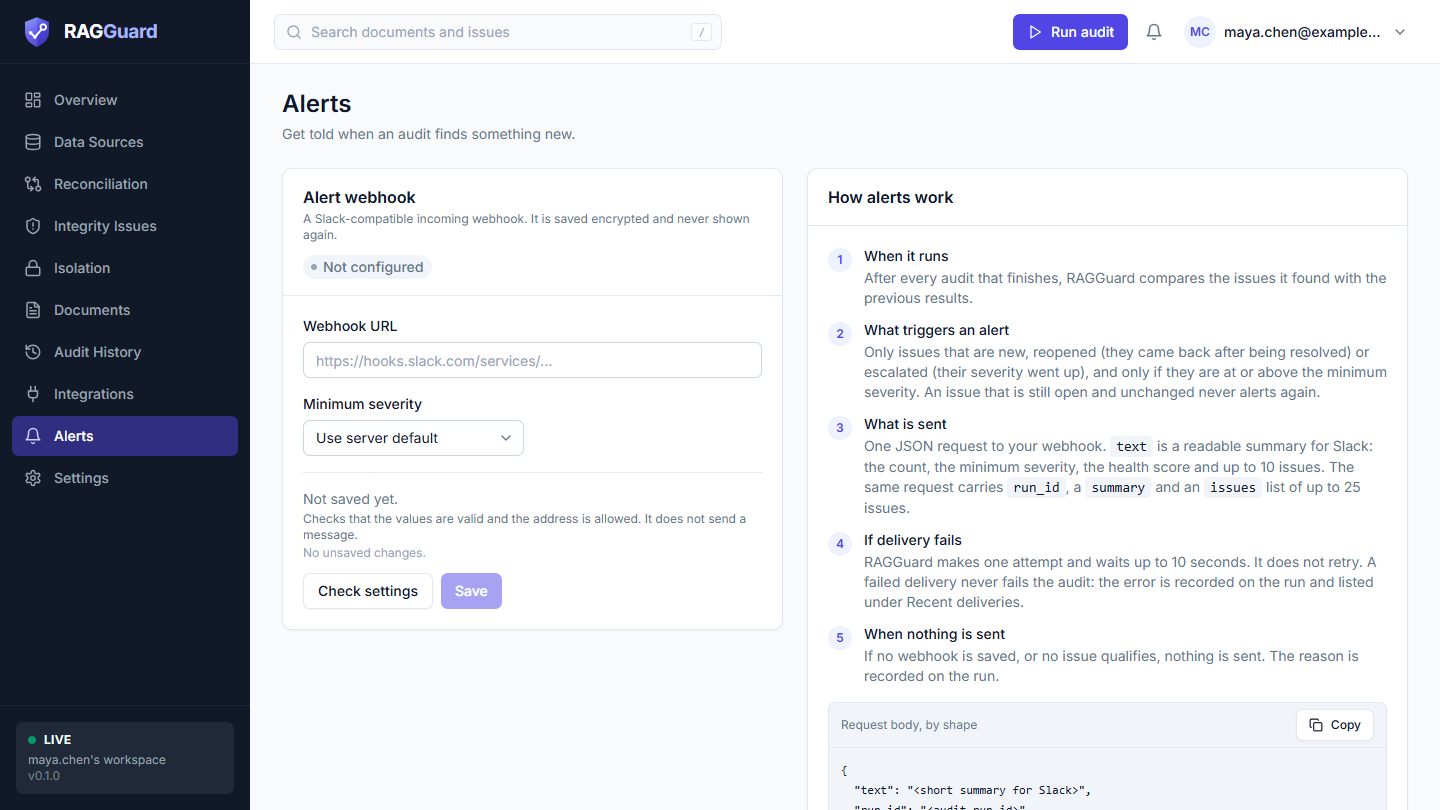
The Alert webhook card.
Do:
- In the Alert webhook card, enter the Webhook URL of a Slack-compatible incoming webhook. It is saved encrypted and never shown again.
- Choose a Minimum severity: critical, high, medium or low. If you leave it on "Use server default" it is
high. - Click Check settings. It validates the values and sends no message.
- Click Save.
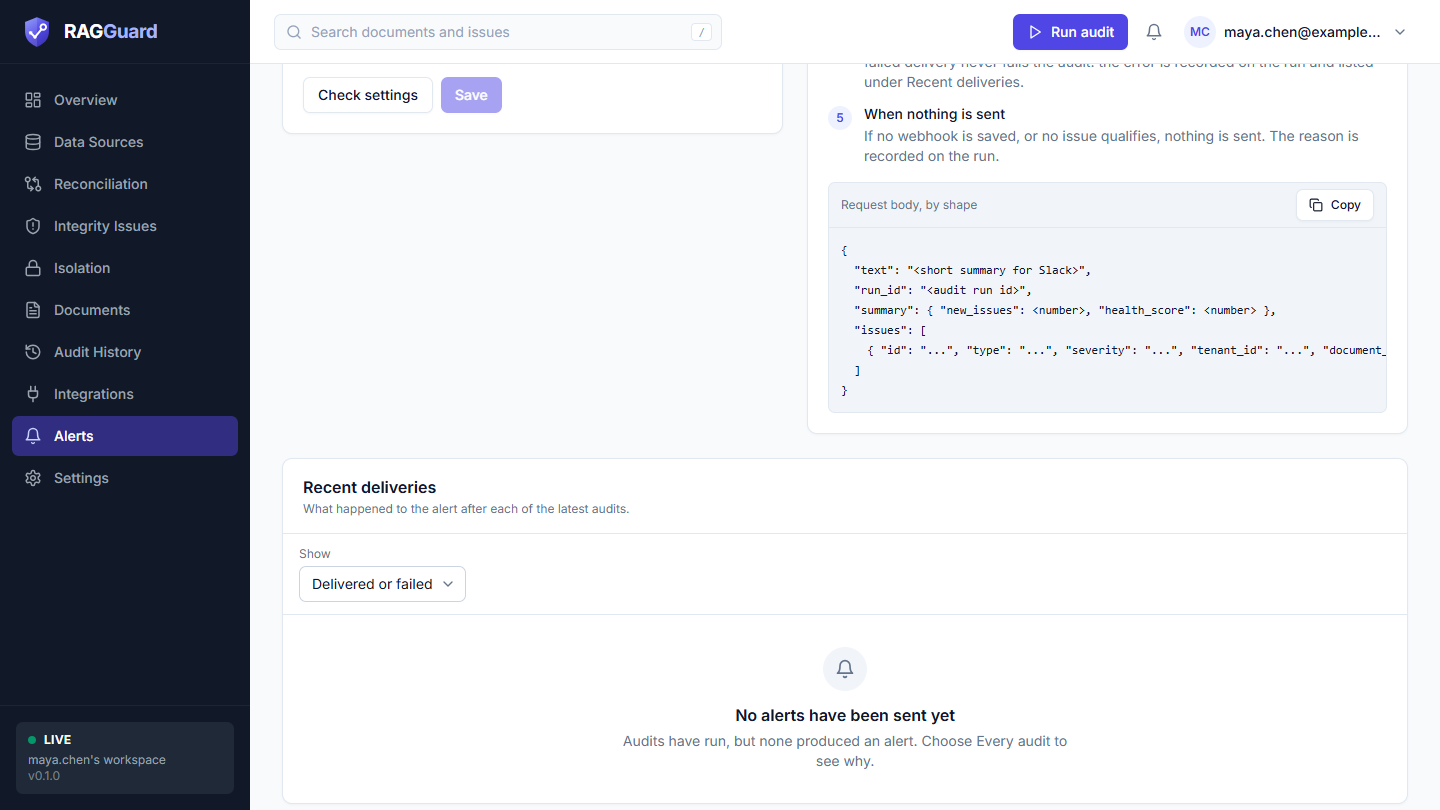
The "How alerts work" card and the shape of the request body.
You should see: the badge Configured. From now on, after every audit that finishes, RAGGuard compares what it found with the previous results and sends one message about issues that are new, reopened or escalated (more severe), and at or above your minimum severity. An issue that is still open and unchanged never alerts again, so a steady state is silent. There is one attempt with a 10-second wait and no retry, and a failed delivery never fails the audit.
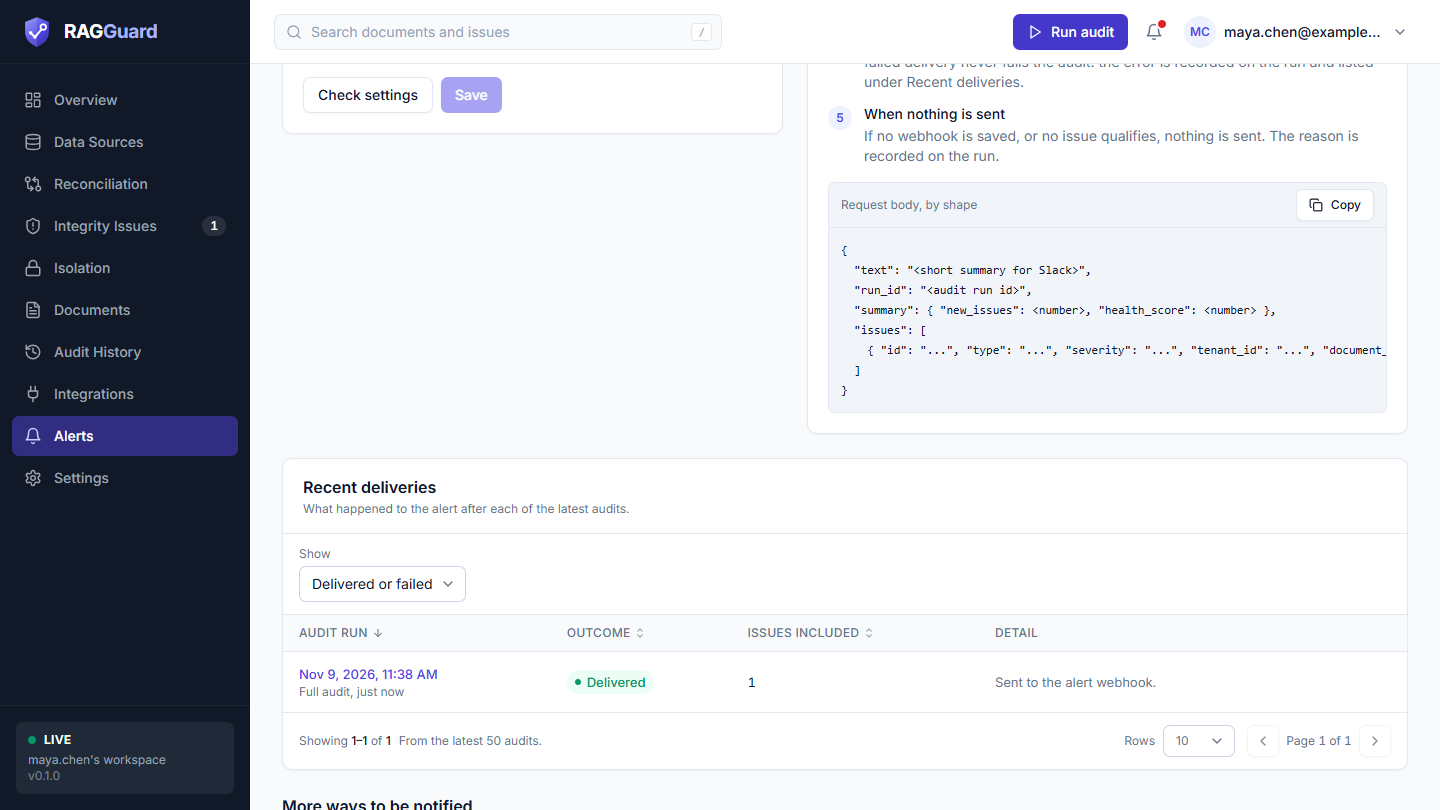
Recent deliveries. Outcomes: Delivered, Failed, Not sent.
What good looks like: after an audit that opens a new issue, Recent deliveries shows Delivered with "Sent to the alert webhook." and the message arrives in your Slack channel. To see why other audits sent nothing, set Show to Every audit: the reason is "No new issues at or above the minimum severity." or "No alert webhook was configured."
Not available yet: per-issue-type rules and quiet hours are marked Not available yet. The Email me setting, the webhook and the minimum severity are the controls. Slack, Jira and PagerDuty integrations are also Not available yet on Integrations; use the alert webhook to forward findings.
If it did not work: see "Alerts not arriving" in Troubleshooting. More in Alerts.
Step 16: Schedule audits with an API key
The hosted app has no built-in scheduler, so a scheduled audit is a call to RAGGuard's API from a scheduler you already have (GitHub Actions, cron, a CI job). That call needs an API key.
Open: Integrations, the API keys card.
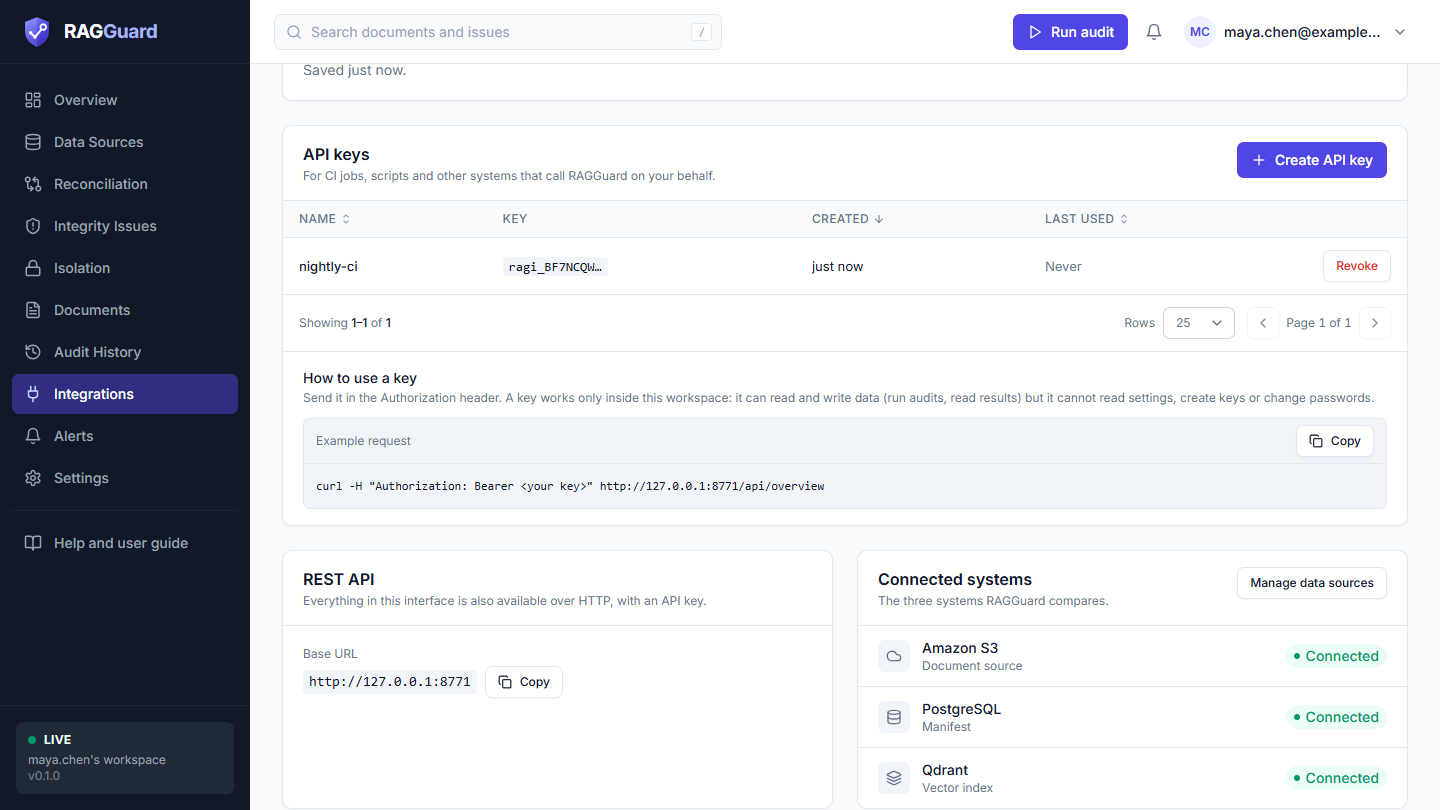
API keys, with a ready-made example request under "How to use a key".
Do:
- Click Create API key.
- Type a Name after what will use it, for example "Nightly audit job" (up to 80 characters), and click Create key.
- The dialog "Your new API key" shows the token once. Click Copy token and store it somewhere safe, such as your CI system's secret store. Then click I've copied it. The dialog cannot be dismissed in any other way, and RAGGuard keeps only a hash of the token, so it cannot show it again.
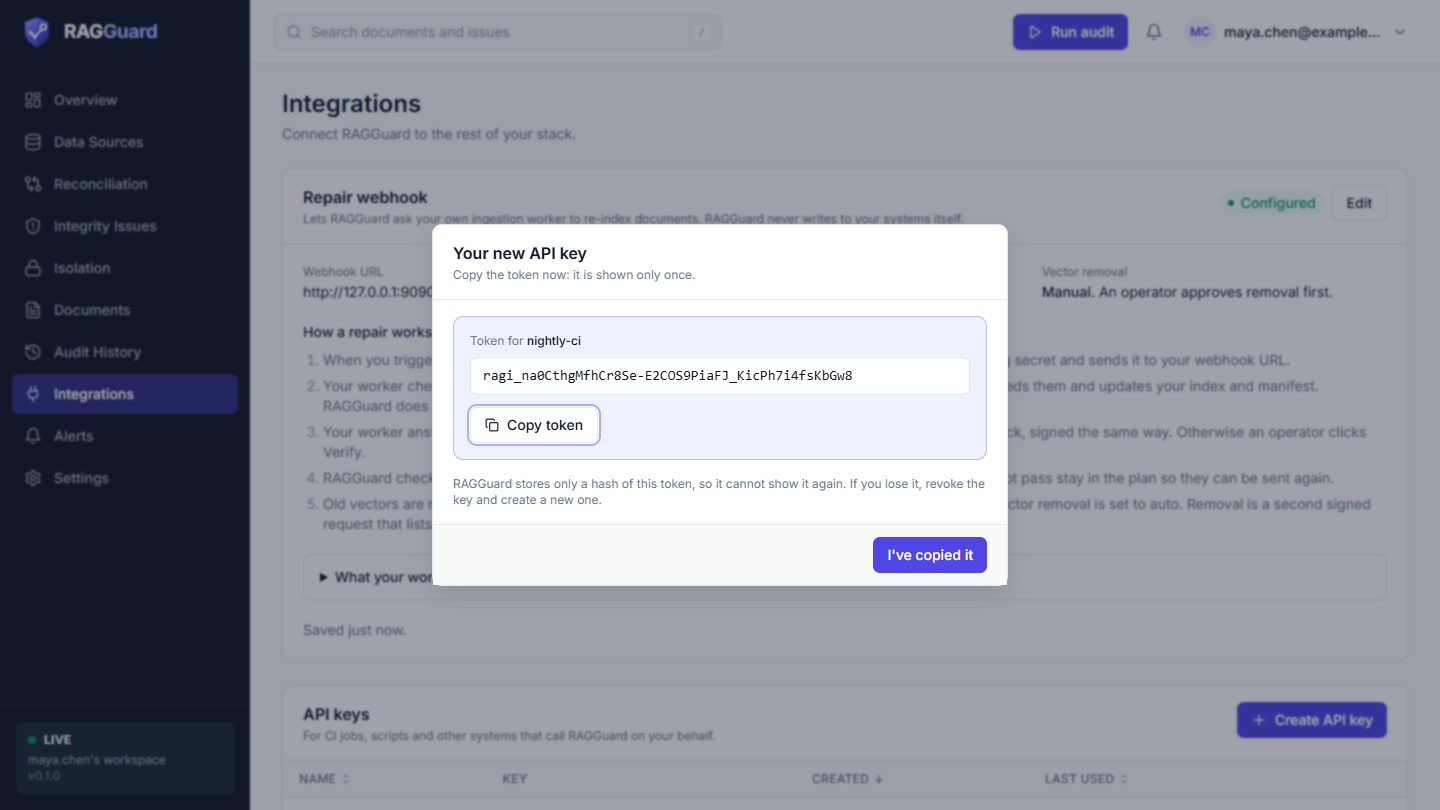
The token is shown once. Lose it and you must revoke the key and make a new one.
- Test the key from a terminal. Replace the address and the token:
curl -H "Authorization: Bearer ragi_xxxxxxxx" https://your-ragguard-address/api/overview
You should see: a JSON answer with your health and counts. In the table, the key's Last used column changes from "Never" to a time (it is written at most once every 10 minutes).
A key works only inside your workspace. It can run audits and read results, and it can also work with issues and repair plans, but it cannot read settings, create or revoke keys, or change your password. Use Revoke (it takes effect immediately) if a key leaks. You can have up to 20 keys.
Now schedule the audit. Ready-to-copy GitHub Actions and cron examples that start an audit and fail when open critical issues exist are in Practical use cases, under "A nightly or CI audit through the API".
What good looks like: the next morning, Audit history shows a full audit with the trigger Api, and your scheduler's job is green (or red, if critical issues are open).
If it did not work: a 401 means the key is wrong or revoked. See "API key problems" in Troubleshooting. More in Integrations.
Step 17: Keep monitoring
Once the loop works, the routine is small.
| When | Do this | Where |
|---|---|---|
| Every day, or when an alert arrives | Check the health score and the open critical and high issues | Overview, Integrity issues |
| After each scheduled audit | Skim the Changes column for new issues | Audit history |
| After you change your pipeline (a new embedding model, a new chunk size) | Estimate the impact before you roll it out, then set the new target pipeline | Integrity issues, Impact analysis; Settings, Pipeline |
| After an outage in ingestion | Find every document touched during the outage | Integrity issues, Impact analysis, Ingestion failure |
| After any repair | Always run Verify now, then a full audit | Repair plans, Reconciliation |
| After each full audit, if you have more than one tenant | Check that the banner says No leaks found (see Isolation) | Isolation |
| Once a month | Review the Ignored issues, and reopen any that no longer apply | Integrity issues, Status filter |
| When something looks wrong in the app itself | Look at Connection health, and Refresh status on Data sources | Overview, Data sources |
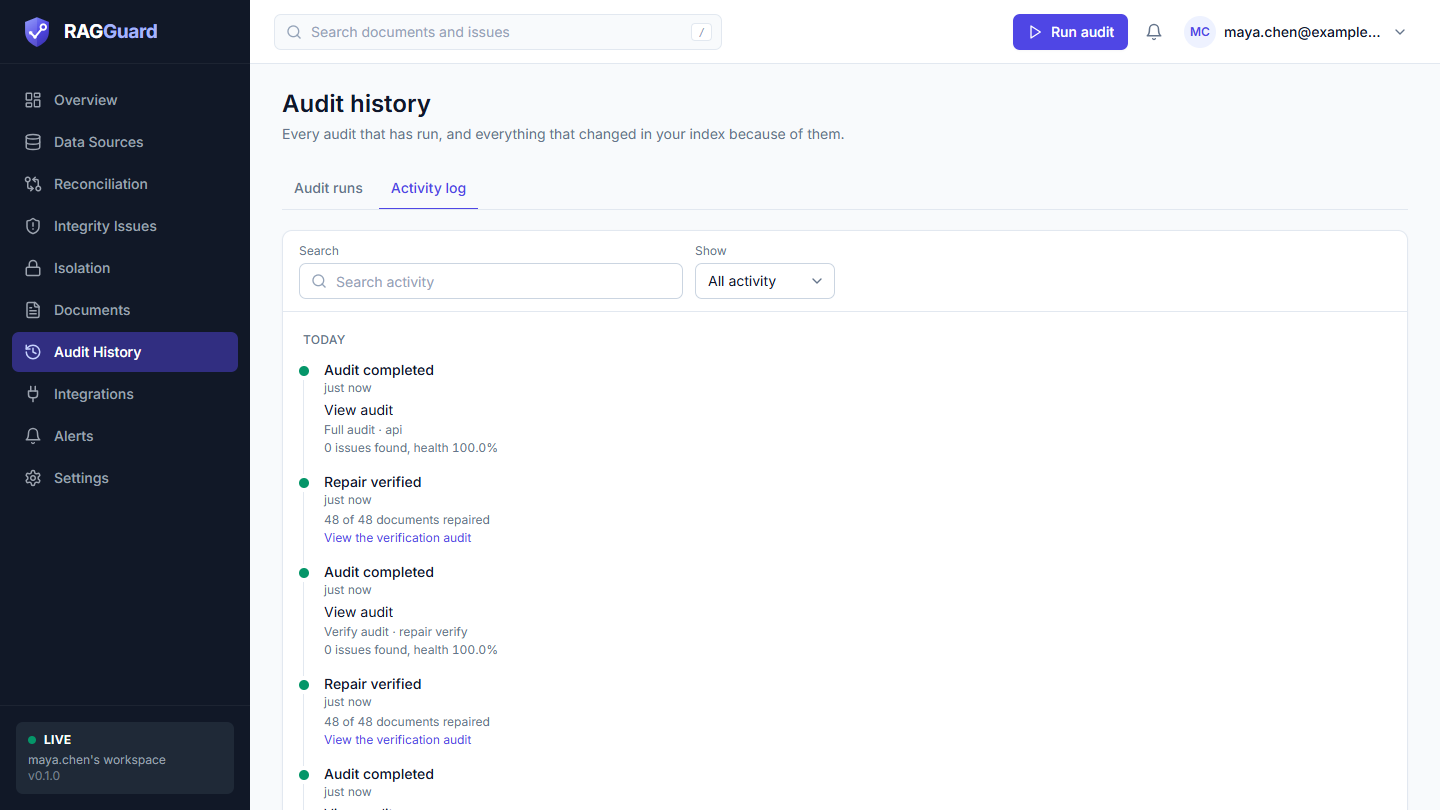
The Activity log is a single timeline of everything: issues found and resolved, repairs sent and verified, audits run.
What good looks like: a health score that stays green, an Activity log with no unexplained surprises, and an alert channel that is quiet most days.
If it did not work: see Troubleshooting, and the section "How to collect information for a bug report" at the end of it.
Related chapters
- Getting started and Concepts you need
- Sign in and find your way around
- Connect your data sources
- Overview, Reconciliation, Integrity issues
- Repair plans, Impact analysis and Isolation
- Documents and Audit history
- Integrations, Alerts and Settings
- Practical use cases, Reference: every value and Troubleshooting