Impact analysis
Impact analysis answers the question "how much of my index would this touch, and what would it cost to fix?" before you do anything. It is the third tab of the Integrity Issues page. You choose one of three scenarios (your current open issues, a pipeline change you are thinking about, or an ingestion failure during a time window), press Analyze impact, and RAGGuard reports how many documents and tenants are affected, how much re-processing and money that means compared with re-embedding everything, and, if you send it your search logs, how many real user queries touched the affected documents. Nothing in your systems is read or changed by this tab: it works from the results of your latest audit.
On this page
- Purpose and who needs it
- How to open it
- The page at a glance
- Step-by-step tasks
- The form: scenarios and inputs
- What each scenario computes
- The result
- The query log: how to send it
- When to use which scenario
- States you may see
- Tips and common mistakes
- Related chapters
Purpose and who needs it
Use it to put numbers on a decision. A team lead can ask "how bad is it, and what does the repair cost?" An AI engineer planning to move to a new embedding model can ask "how many documents would need re-embedding?" After an incident, an operator can ask "which documents did the pipeline touch while the job was broken?"
Terms used here (more in Concepts you need):
- Document: one file in your source, identified by tenant and document id.
- Tenant: one customer, team or business unit whose documents are kept apart.
- Chunk: a searchable piece of a document. Reindex: rebuilding a document's chunks and vectors.
- Pipeline fingerprint: how a document's vectors were produced: parser version, chunking version, chunk size, chunk overlap, embedding model, embedding model version and so on. RAGGuard reads it from your index and manifest.
- Query log: a record of which documents your assistant retrieved for each question. You send it to RAGGuard; see below.
How to open it
Click Integrity Issues in the left menu, then the Impact analysis tab. The address is /issues?view=impact. If your three systems are not connected yet, the page shows "Connect your data sources first".
The page at a glance
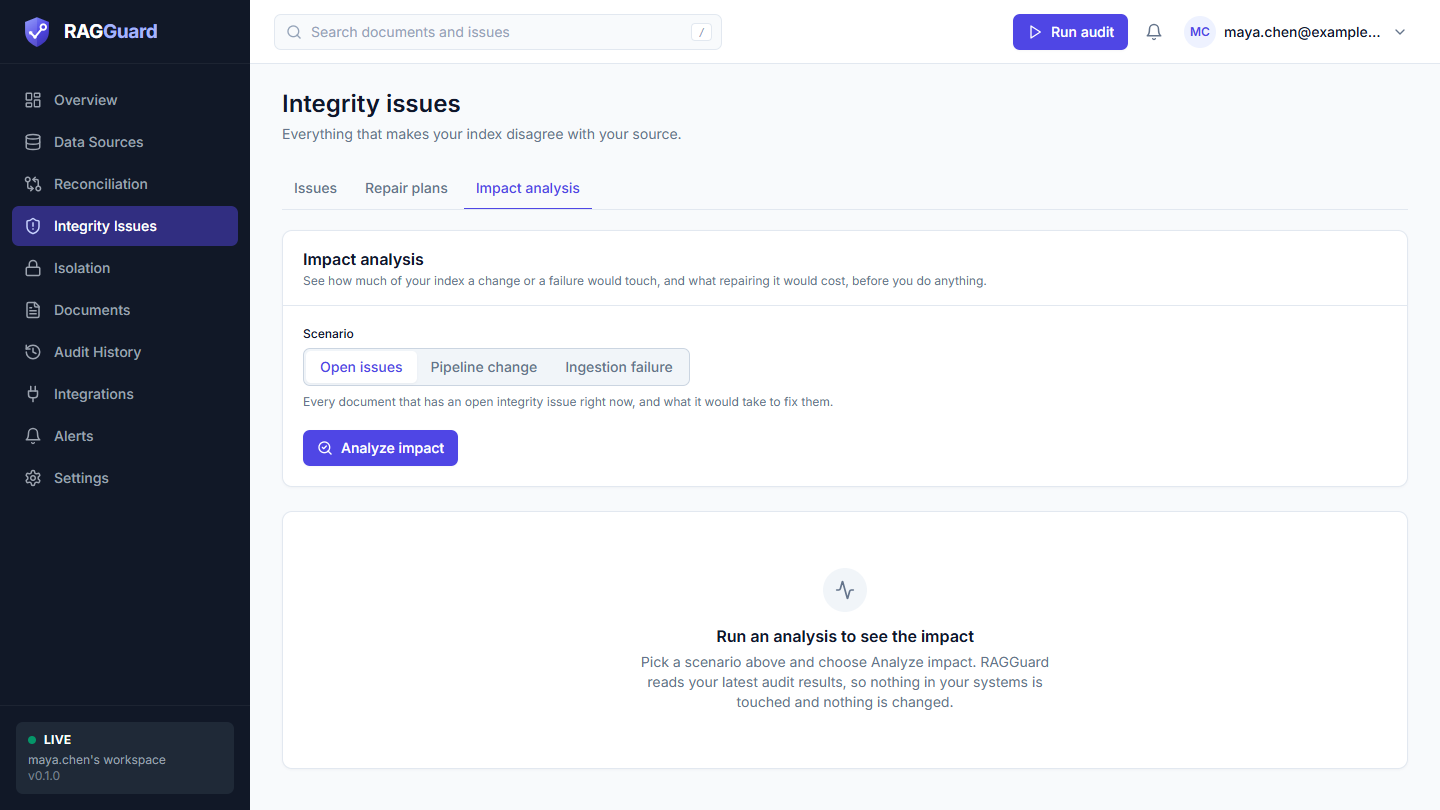
The Impact analysis tab before you run anything.
- A card titled Impact analysis with the line "See how much of your index a change or a failure would touch, and what repairing it would cost, before you do anything."
- A Scenario chooser with three options: Open issues, Pipeline change, Ingestion failure, and a sentence explaining the chosen one.
- The inputs for that scenario (none for Open issues).
- The Analyze impact button.
- Below, the result, or the empty message "Run an analysis to see the impact".
Step-by-step tasks
See what your open issues would cost to fix
- Leave Open issues selected.
- Click Analyze impact.
- Read the five cards at the top, then Query impact.
- If the numbers look reasonable, go to the Repair plans tab (Repair plans).
Plan a pipeline change
- Choose Pipeline change.
- Fill in only the settings of the pipeline you are thinking of moving to (see the table below). Leave the others empty.
- Click Analyze impact.
- Read how many documents are affected, how many of them are "Confirmed" and how many are only "Possible", and the cost compared with a full reindex.
Investigate an ingestion failure
- Choose Ingestion failure.
- Enter Started at. Enter Ended at if the problem is over, or leave it empty for "until now".
- Click Analyze impact.
- Look at the affected documents. Those marked "Confirmed" already have an open issue. Run a scoped audit of the affected tenants to check the rest (Reconciliation).
The form: scenarios and inputs
Changing the scenario clears the previous result and any form message. The inputs you typed stay while you remain on this tab; they are cleared when you switch to another tab or page.
Open issues
"Every document that has an open integrity issue right now, and what it would take to fix them." No inputs.
Pipeline change
"Which documents would need re-processing if you changed your parser, chunking or embedding model. Enter the pipeline you are thinking of moving to."
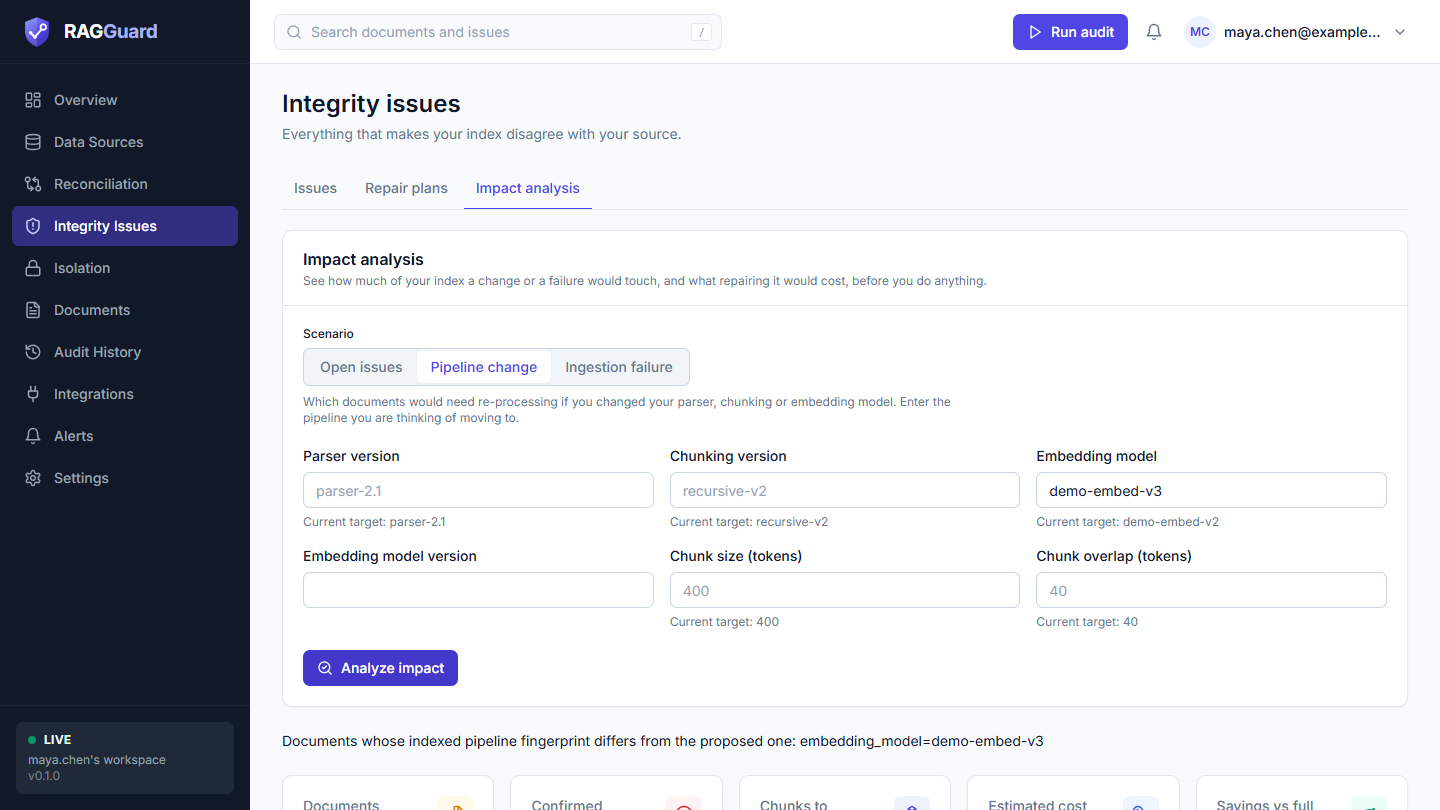
The Pipeline change scenario.
| Field | Type | Meaning |
|---|---|---|
| Parser version | Text | The version of the parser that turns files into text. |
| Chunking version | Text | The version of the method that cuts text into chunks. |
| Embedding model | Text | The name of the embedding model, for example the model you want to switch to. |
| Embedding model version | Text | The version of that model. |
| Chunk size (tokens) | Whole number above zero | How many tokens each chunk should have. |
| Chunk overlap (tokens) | Whole number, zero or more | How many tokens neighbouring chunks share. |
Each field shows a hint "Current target: ..." and the same value as a faded placeholder when your workspace already has a target pipeline saved (Target pipeline in Settings). Fill in at least one field. Only the fields you fill in are compared.
Ingestion failure
"Which documents the pipeline touched during a time window, for example while a job was failing."
| Field | Meaning |
|---|---|
| Started at (required) | A date and time picker. The hint says "Your local time." |
| Ended at | A date and time picker. The hint says "Leave empty for until now." |
Validation messages
If an input is not valid, a red box above the button explains why and nothing is sent.
| Message | Cause |
|---|---|
| "Enter at least one setting of the pipeline you want to analyze." | Pipeline change with every field empty. |
| "Chunk size (tokens) must be a whole number above zero." | A decimal, text, zero or a negative number in Chunk size. |
| "Chunk overlap (tokens) must be a whole number." | A decimal, text or a negative number in Chunk overlap. |
| "Choose when the failure started." | Ingestion failure without Started at. |
| "The start time is not a valid date." / "The end time is not a valid date." | A date the browser cannot read. |
| "The end time must be after the start time." | Ended at is earlier than Started at. |
If the server itself refuses the request, its message appears in the same red box with a warning icon.
What each scenario computes
All three scenarios read the document list of your latest audit. They do not touch S3, the manifest or Qdrant. The accuracy of the answer therefore depends on how recent that audit is: run a new audit first if things have changed (Reconciliation).
| Open issues | Pipeline change | Ingestion failure | |
|---|---|---|---|
| A document is affected when | It has at least one open issue on that document. Whole-collection findings are not documents and are not counted. | Its source still exists and the pipeline fingerprint recorded for it differs from what you entered in at least one field, or it has no recorded value for a field you entered. | The manifest says the document was last updated between Started at and Ended at. Documents with no manifest update time are never matched. |
| "Confirmed" means | All affected documents are confirmed, because each has an open issue. | RAGGuard knows the index differs from your proposed value for a field you entered. | The document also has an open issue. |
| "Possible" means | Not used. | A field you entered is not recorded for that document, so RAGGuard cannot tell whether it differs. | The document was processed in the window but has no open issue. It may be fine. |
| Work estimated | The smallest safe action for each document, exactly as in Recommended work: a full reindex, a re-embed of missing chunks, a metadata fix or a removal. | Every affected document counts as a full reindex, including the possible ones. This is the worst case. | Every affected document counts as a full reindex. This is the worst case. |
The cost model is the same as in Repair plans: chunks to regenerate come from the manifest's expected chunk count (with fallbacks), multiplied by the tokens per chunk and your embedding price. The comparison figure is the same calculation for every document whose source still exists.
The result
After you click Analyze impact the button shows a spinner and grey placeholders appear. Then the result replaces them.
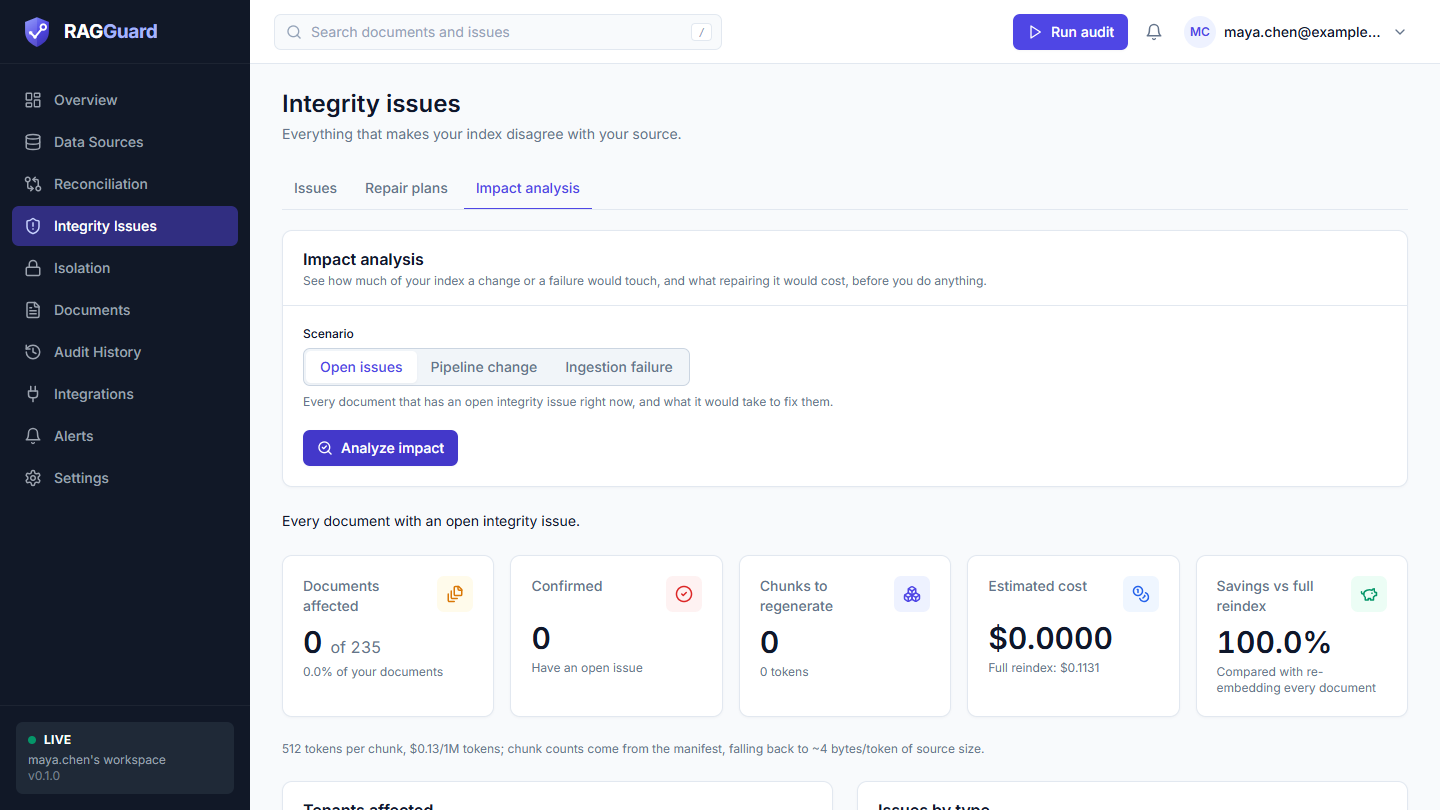
The result of an analysis.
The description
A sentence at the top says what was analyzed:
- Open issues: "Every document with an open integrity issue."
- Pipeline change: "Documents whose indexed pipeline fingerprint differs from the proposed one:" followed by your values, for example
embedding_model=.... - Ingestion failure: "Documents the pipeline processed between" two timestamps (in UTC) "and" the end.
The five cards
| Card | What it shows | How to read it |
|---|---|---|
| Documents affected | "N of M" and "P% of your documents". M is all documents in your latest audit. | The size of the problem. A small percentage can still be urgent if the documents are popular, see Query impact. |
| Confirmed | The number of affected documents that are confirmed. The hint is "Have an open issue" (Open issues), "Index known to differ from the proposed pipeline" (Pipeline change) or "Already have an open issue" (Ingestion failure). | The part that is certain. The rest, "Possible", needs checking. |
| Chunks to regenerate | The number of chunks your worker would have to create, and the estimated tokens as a hint. | The size of the re-processing job. |
| Estimated cost | The cost in US dollars, with "Full reindex:" and the cost of re-embedding everything as a hint. | Compare the two numbers. |
| Savings vs full reindex | The percentage saved compared with re-embedding every document. Hint "Compared with re-embedding every document". Hidden when it cannot be calculated. | Close to 100% means a targeted fix is far cheaper than starting over. A low or zero value, as is typical for a pipeline change, means you would be re-embedding almost everything. |
Under the cards a small line gives the assumptions, for example "512 tokens per chunk, $0.13/1M tokens; chunk counts come from the manifest, falling back to ~4 bytes/token of source size." The values come from Audit policy in Settings.
Tenants affected
A table with the heading Tenants affected and the line "Documents affected out of each tenant's total." Only tenants with at least one affected document appear.
| Column | Meaning |
|---|---|
| Tenant | The tenant name. |
| Affected | Affected documents of that tenant. |
| Total | All documents of that tenant in the latest audit. |
| Share | A bar: affected divided by total. |
If no tenant is affected: "No tenants affected": "This scenario does not touch any documents."
Issues by type
The heading is Issues by type with the line "Open issues on the affected documents." One bar per issue type with its count, biggest first. It counts open issues on the affected documents, whatever the scenario. If there are none: "The affected documents have no open issues." The bar names are the 11 issue types (Integrity issues).
Below a divider, Collections affected (shown when there are any) lists the names of the index collections that hold the affected documents' vectors.
Query impact
The heading is Query impact with the line "Recent searches that returned an affected document (last 14 days)." It uses your query log.
- With no log in the last 14 days: "No query log has been ingested yet, so the effect on real searches can't be measured. Send your retrieval logs to POST /api/query-log and this section will show how many queries touched the affected documents." (The same message is shown if you did send a log but all its rows are older than 14 days.)
- With a log you see "N of M queries": M is the number of logged queries in the last 14 days, and N is how many of them retrieved at least one affected document (same tenant, same document id). Under it: "P% of queries in the window returned an affected document".
- Most requested affected documents lists up to 8 affected documents that appear most often in the log, each with its tenant and "N queries" (or "1 query"). A click opens the document panel (Documents).
How to read it: the percentage is the share of real user questions that were exposed to the problem. A pipeline change that touches 80% of documents but 5% of queries is less urgent than an orphan document that appears in a third of all queries. The list tells you which documents to fix first.
Affected documents
The heading is Affected documents. The line says "A sample of 25 of N affected documents." when there are more than 25, otherwise "Every affected document." Each row has the file name, the tenant, a badge with the document's audit status (Healthy, Degraded, Broken, Pending or Orphaned) and a badge Confirmed (red) or Possible (grey). Click a row to open the document. The sample is the first 25 in alphabetical order by tenant and document id, not the worst ones. Use Documents or the Issues tab to sort by severity. With no affected documents: "No documents affected": "Nothing in your index matches this scenario."
The query log: how to send it
The query log is optional but it turns "N documents are affected" into "N% of your users' questions are affected".
What it is. One entry per search your assistant made: which tenant asked and which documents the retrieval returned. You build it in your own application, where the retrieval happens, and send it to RAGGuard.
What RAGGuard keeps. Only the tenant, the document ids, a short hash of the question and the time. If you send the question text, RAGGuard turns it into a hash (the first 16 characters of a SHA-256 hash) and does not store the text. Entries older than 14 days do not count in the analysis.
How to send it. Make an HTTPS POST request to /api/query-log on your RAGGuard address. In a hosted workspace use an API key created under API keys in Integrations, in the Authorization: Bearer <your key> header. On a single-user server protected by a shared key, send it in the X-API-Key header.
curl -X POST "https://<your-ragguard-address>/api/query-log" \
  -H "Authorization: Bearer <your key>" \
  -H "Content-Type: application/json" \
  -d '{
    "queries": [
      {
        "ts": "2026-11-08T09:14:00Z",
        "tenant_id": "acme",
        "query_text": "How many vacation days do I get?",
        "retrieved_doc_ids": ["policies/leave-policy.md", "policies/travel-policy.md"]
      }
    ]
  }'
The answer is {"ingested": 1}: the number of entries that were accepted.
| Field | Required | Meaning |
|---|---|---|
queries | Yes | A list of entries. At most 5,000 per request; send more in several requests. |
retrieved_doc_ids | Yes, to be counted | The document ids your retrieval returned, exactly as RAGGuard shows them in the Documents table (for example policies/leave-policy.md). Up to 100 per entry. Entries with an empty list are skipped. |
tenant_id | No | The tenant of the search. If left out, the default tenant of your workspace is used. It must match the tenant names RAGGuard shows. |
query_hash | No | A hash you computed yourself, if you prefer not to send the text. |
query_text | No | The question. It is hashed and not stored. Ignored when query_hash is given. |
ts | No | When the search happened, in ISO 8601 form such as 2026-11-08T09:14:00Z. If missing or unreadable, the time of receipt is used. |
A practical way to produce the log: write one line per search in your application (tenant, retrieved document ids, time) and send the lines in batches every few minutes or every hour.
When to use which scenario
| Question | Scenario |
|---|---|
| "How much work and money is it to fix everything that is wrong now? Who is affected?" | Open issues. Do this before creating a plan, and when you need to explain the cost to someone. |
| "We want to switch the embedding model (or the chunk size, parser, chunking method). What would it touch and cost?" | Pipeline change. Enter only what changes. A large "Possible" number means many documents have no recorded pipeline details; record them in your manifest to get a precise answer. |
| "Our ingestion job failed or misbehaved between Tuesday and Thursday. Which documents might be wrong?" | Ingestion failure. Then run a scoped audit of the affected tenants. |
States you may see
| State | What you see | What to do |
|---|---|---|
| Not connected | "Connect your data sources first" (whole page). | See Connect your data sources. |
| Before the first analysis | "Run an analysis to see the impact": "Pick a scenario above and choose Analyze impact. RAGGuard reads your latest audit results, so nothing in your systems is touched and nothing is changed." | Choose a scenario and run it. |
| Running | A spinner on the button and grey placeholders. | Wait a moment. |
| Error from the server | A red box with the message above the button. | Fix the input or try again. |
| No audit has run yet | The numbers are zero ("0 of 0") and the lists are empty. | Run an audit first (Reconciliation). |
Tips and common mistakes
- Audit first. The tab reads your latest audit. If you fixed things since, the numbers are out of date until the next audit.
- Pipeline change is a worst case. Every affected document is costed as a full reindex, including "Possible" ones. The real number may be lower.
- Fill only what changes. A field you leave empty is not compared. A field you fill in with the value you already use will give zero confirmed documents.
- "Possible" is not "fine". It means RAGGuard cannot tell. If you want certainty, make sure your pipeline records its settings.
- No percentage of queries without a log. The cards still work; only Query impact needs the log.
- Ids must match. If Query impact shows zero affected queries even though the log exists, check that the
retrieved_doc_idsandtenant_idin your log are exactly the ones RAGGuard shows in the Documents table. - Time zones. Started at and Ended at are in your local time and are converted for the analysis.