Overview
The Overview is the first page you see after signing in, and the one you will open most often. It answers one question: how healthy is my RAG index right now? It shows a health score, how many documents RAGGuard knows about, how many problems are open and how serious they are, what the last audit found, how each tenant is doing, and whether your three systems are reachable. This chapter explains every card, chart, list and number on the page, what each one means, what good looks like, and what to do next.
On this page
- Purpose, audience and how to open it
- The page at a glance
- Step-by-step tasks
- The Connect your data card
- When there is no audit yet
- The audit-running banner
- The four cards
- The ID warnings notice
- Health over time
- Open issues by severity
- Issues by type
- Document status
- Top open issues
- Tenant health
- The Last audit card
- Connection health
- Which cards appear and where
- States you may see
- Tips and common mistakes
- Related chapters
Purpose, audience and how to open it
Purpose. A one-screen answer to "Is my index consistent with my source, and what needs attention first?"
Who needs it. Everyone. Engineers use it to start an investigation, team leads to see the trend, and on-call staff to decide whether an alert matters.
How to open it. Choose Overview in the sidebar, or open the root address /. It is also where you land after you sign in from the landing page or the /login address. The page title reads "Overview", with the line "How healthy your RAG index is right now."
What it is not. The Overview is not live. It shows the results of the latest audits. It refreshes when you open it, after you act, and every 3 seconds while an audit is running. Audits only happen when something starts them: you, a script that uses an API key, or on a single-user server a schedule.
The page at a glance
The page is made of cards. From top to bottom:
| Row | Cards | Tells you |
|---|---|---|
| Banner (sometimes) | Audit-running banner | An audit is in progress. |
| 1 | Health score, Documents, Open issues, Last audit | The four numbers that matter most. |
| Notice (sometimes) | ID warnings notice | The latest full audit saw document IDs it could not tell apart. |
| 2 | Health over time, Open issues by severity | Where you are heading and how urgent the open problems are. |
| 3 | Issues by type, Document status | What kinds of problems you have and how your documents are distributed. |
| 4 | Top open issues, Tenant health (left) and Last audit, Connection health (right) | What to fix first, which tenant is worst, what the last audit changed, and whether your systems respond. |
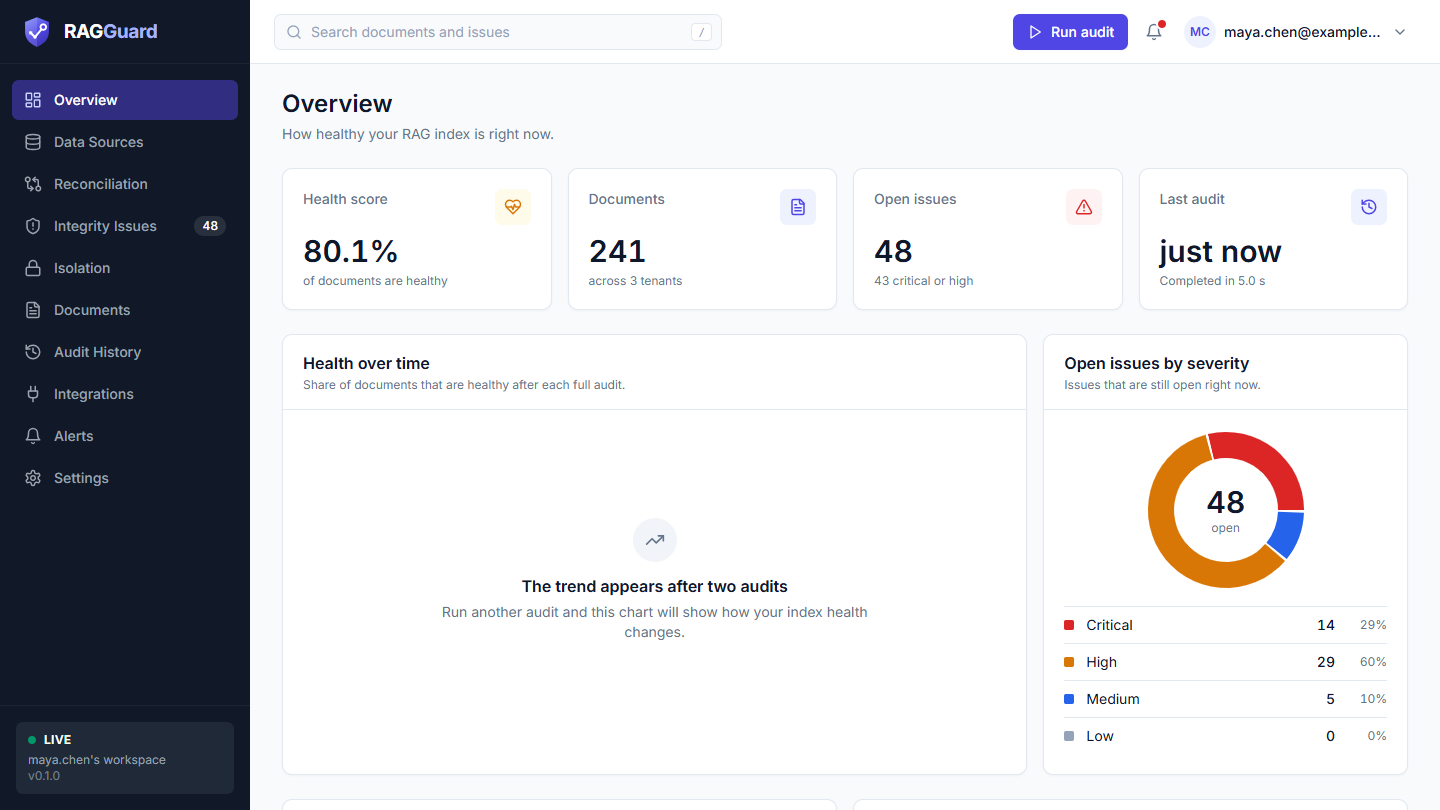
The top of the Overview: the four cards, then Health over time and Open issues by severity.
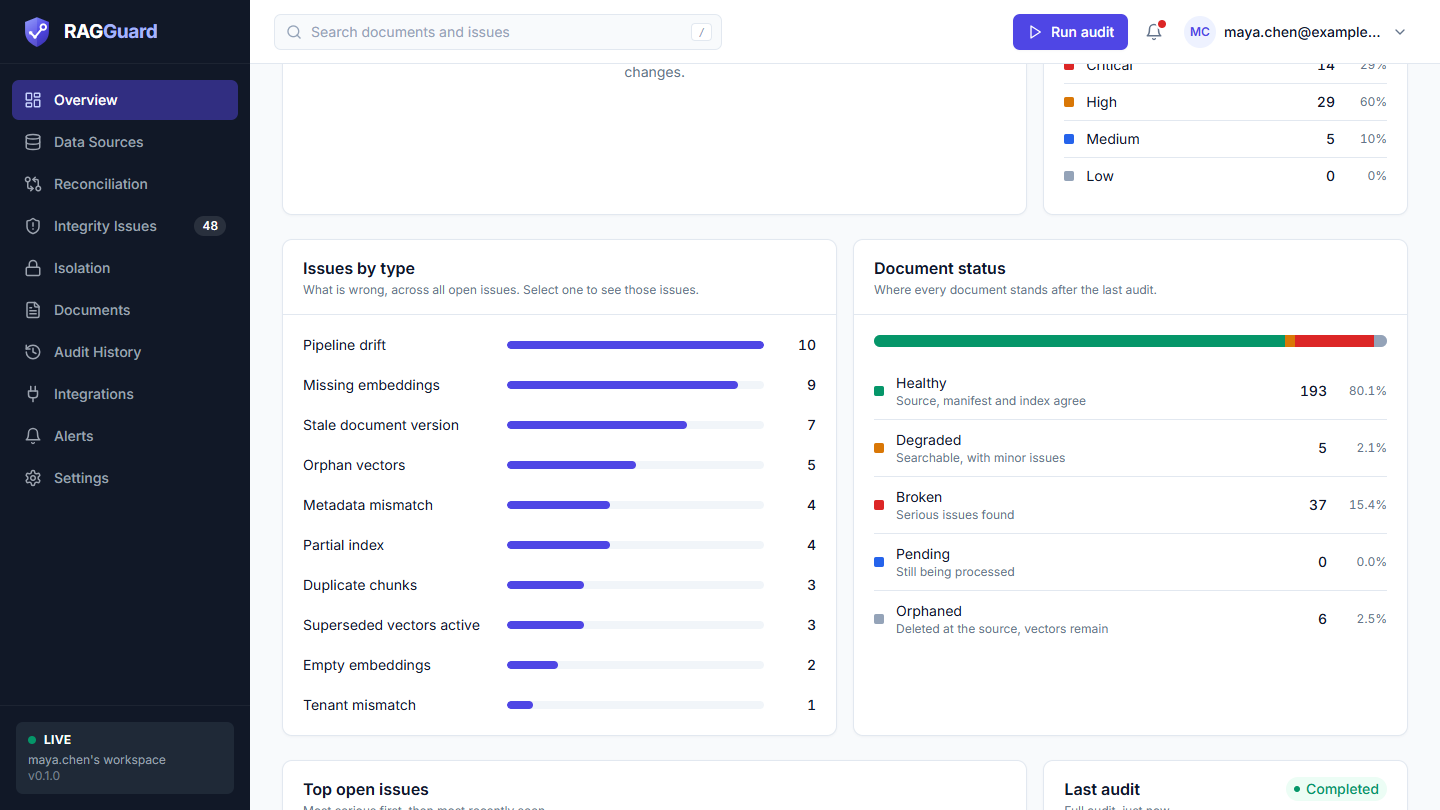
The middle of the Overview: Issues by type and Document status.
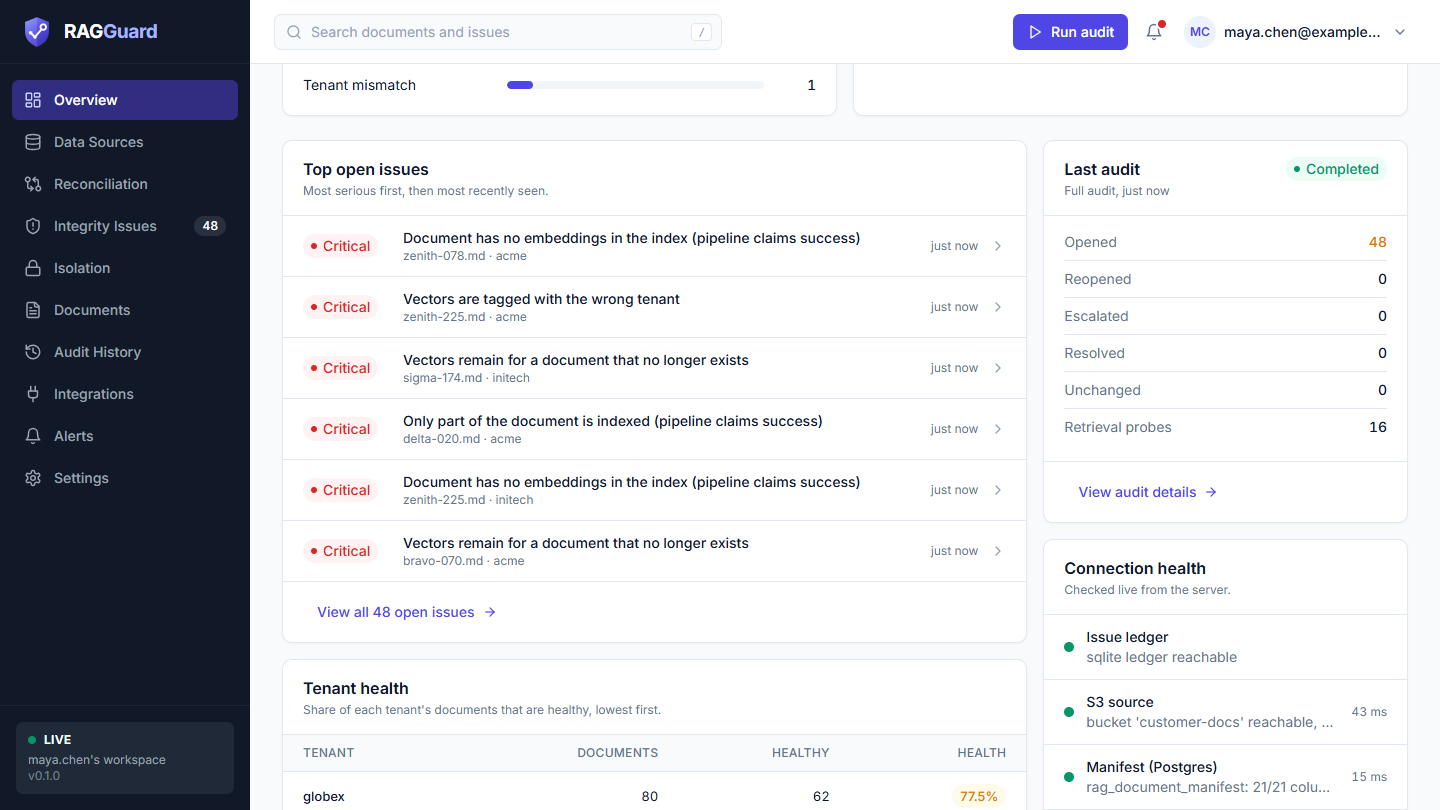
The bottom of the Overview: Top open issues, Tenant health, Last audit and Connection health.
Almost everything on the page is a shortcut: cards, legend rows, bars and list rows open the page that explains them.
| Click... | You go to... |
|---|---|
| The Open issues card | Integrity Issues |
| The Last audit card, or View audit details | That audit's page in Audit History |
| A row in Open issues by severity | Integrity Issues, filtered to that severity |
| A bar in Issues by type | Integrity Issues, filtered to that type |
| A row in Document status | Documents, filtered to that status |
| A tenant in Tenant health | Documents, filtered to that tenant |
| An issue in Top open issues | That issue's panel |
| View all N open issues | Integrity Issues |
| Manage data sources | Data Sources |
Step-by-step tasks
Check the health of your index in half a minute
- Open Overview.
- Look at the Health score. Green means 90% or more.
- Look at Open issues and its line under the number. "None critical or high" is what you want to read.
- Look at Last audit. Check it is recent and says Completed.
Decide what to fix first
- Read Open issues by severity. Start with Critical, then High.
- Read Top open issues: it lists the most serious ones first.
- Click an issue to read its evidence and its recommended fix (Integrity issues).
- When you are ready, create a repair plan (Repair plans).
Check that the last audit worked
- Look at the Last audit card. The badge says Completed, Running or Failed.
- If it says Failed, a red box shows the reason. Click View audit details for the full page, then see Troubleshooting.
- If the audit is old, press Run audit in the top bar.
Find the tenant with the worst health
- Scroll to Tenant health. The lowest score is at the top.
- Click the tenant to open Documents filtered to it.
See what changed since the last time
- In Last audit, read Opened, Reopened, Escalated and Resolved.
- Click View audit details. The audit's page lists the new and the resolved issues by name (Audit history).
The Connect your data card
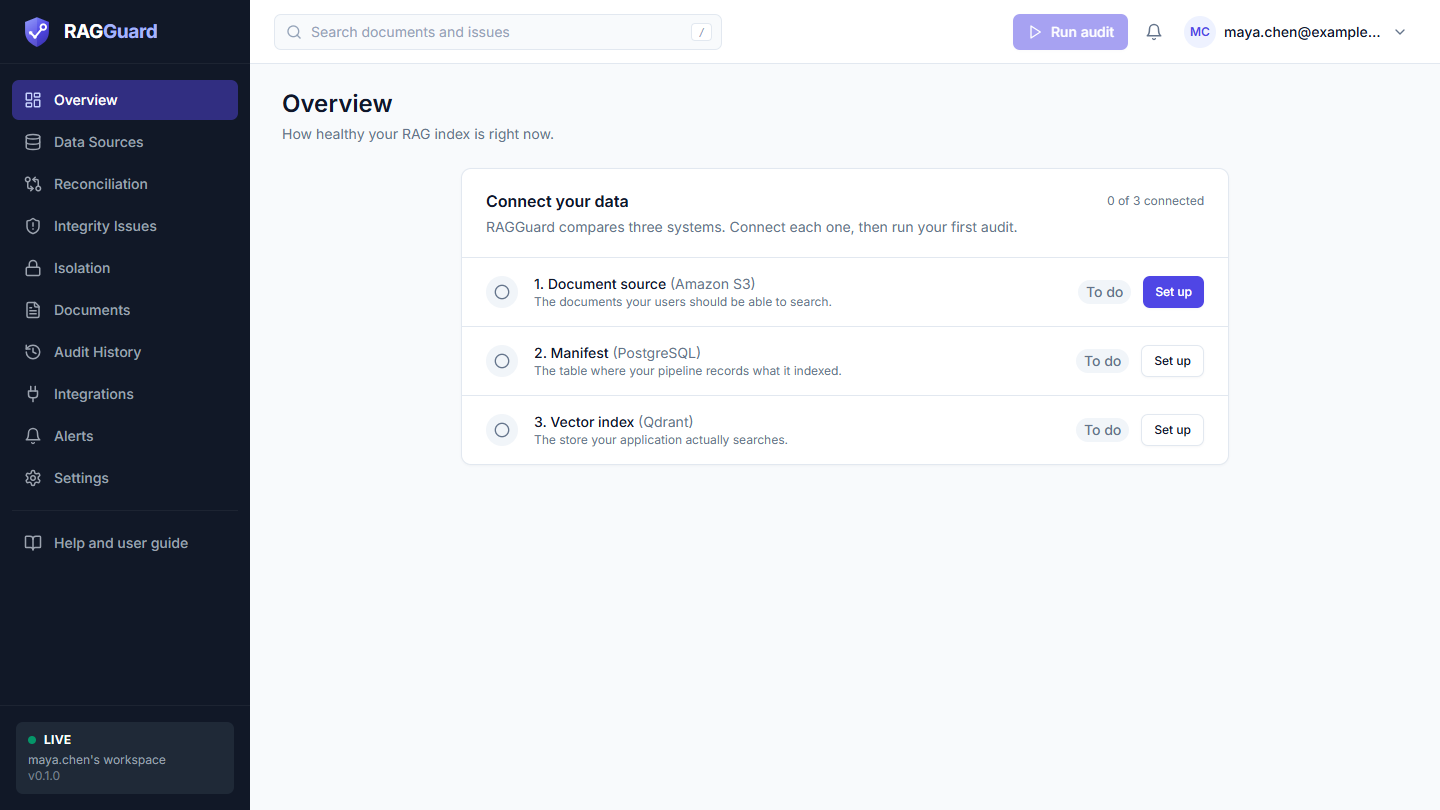
The Overview of a brand-new workspace: the "Connect your data" card with its three steps.
On a hosted server, until your source and your vector index are saved, the Overview shows only this card instead of the dashboard. It sits in the middle of the page.
| Part | What it shows |
|---|---|
| Heading Connect your data | With a counter on the right such as "1 of 2 connected" (the manifest is not counted). |
| Line | "RAGGuard compares your documents with your vector index. Connect both, then run your first audit. A manifest is optional." |
| Step 1. Document source (Amazon S3) | "The documents your users should be able to search." |
| Step 2. Vector index (Qdrant or pgvector) | "The store your application actually searches." |
| Step 3. Manifest (PostgreSQL, optional) | "Optional. The table where your pipeline records what it indexed. It adds checks, but audits work without it." Its badge says Optional |
| Badge on each step | To do (grey) or Done (green). A check mark replaces the empty circle when a step is done. |
| Button on each step | Set up while the step is to do, Review once it is done. The button of the next step to do is blue and filled; the others are plain. Every button opens Data Sources. |
"Done" means the connection is saved with its required fields. It does not mean it passed a test. Use Test connection on Data Sources for that (Connect your data sources).
Once the source and the index are done the card disappears and the dashboard takes its place. Single-user servers never show this card, because their connections come from the server.
When there is no audit yet
When all three systems are connected but no audit has ever run, the page shows:
- An empty card with the title No audit has run yet, the text "Run your first audit to compare your source documents, your manifest and your vector index.", and a Run first audit button. If the button is disabled, hover over it to read why.
- Below it, the Connection health card, so you can check that your systems respond before you start.
Press Run first audit. While it runs, the page shows the audit-running banner, and the full dashboard appears when it finishes.
The audit-running banner
While any audit is running in your workspace, a blue banner appears at the top of the page: "An audit is running. This page updates when it finishes." You do not need to reload. The page checks every 3 seconds and fills in when the audit ends, and a notice appears (Sign in and find your way around). It does not matter who started the audit: you, a colleague, a script or a repair verification.
The four cards
Health score
| Shows | The share of documents that are healthy, for example 92.5%. It has one decimal. |
| Line below | "of documents are healthy". With no documents it says "No documents audited yet" and the value is a dash. |
| How it is calculated | (documents that are Healthy + documents that are Pending) ÷ all documents × 100. Degraded, Broken and Orphaned documents count against you. See Concepts: health score. |
| Colour of its icon | Green at 90% or more, amber at 70% up to 90%, red below 70%, grey when there is no score. |
| What good looks like | Green. A score of 100.0% means every document is healthy or still pending. |
| What to do next | If amber or red, read Open issues by severity and Top open issues. |
| Click | Nothing. |
The score covers every document RAGGuard currently knows, including those last checked by scoped audits.
Documents
| Shows | How many documents RAGGuard knows about, for example 1,240. |
| Line below | "across N tenants", or "across 1 tenant". |
| What counts | Every document that exists in S3, in the manifest or as vectors in the index. A deleted file whose vectors remain still counts, as an orphaned document. |
| What good looks like | Roughly the number of files you expect to be searchable. A big gap can point at a key pattern problem. |
| What to do next | If the number surprises you, check the S3 Key pattern and Key prefix on Data Sources. |
| Click | Nothing. |
Open issues
| Shows | The number of issues that are Open right now. Resolved and ignored issues are not counted. |
| Line below | "None critical or high", or "N critical or high". |
| Colour of its icon | Green when there are none. Red when at least one is Critical or High. Amber when all open issues are Medium or Low. |
| What good looks like | 0, or none critical or high. |
| What to do next | Click the card to open Integrity Issues. |
| Click | Opens Integrity Issues. |
Last audit
| Shows | How long ago the most recent audit finished (or started, if it has not finished): just now, 12 min ago, 3 h ago, 2 d ago, or a date after 30 days. |
| Line below | "Running now" while it runs. Otherwise its status and how long it took, for example "Completed in 3.2 s" or "Failed in 1.0 s". Durations read 850 ms, 3.2 s or 2m 5s. |
| Colour of its icon | Red when it failed, blue while it runs, indigo otherwise. |
| Which audit | The most recent audit of any kind: full, scoped or verify (the checks RAGGuard runs after a repair). |
| What good looks like | Recent, and Completed. |
| What to do next | If it failed, click the card for the reason. If it is old, run another audit. |
| Click | Opens that audit's page. |
The ID warnings notice
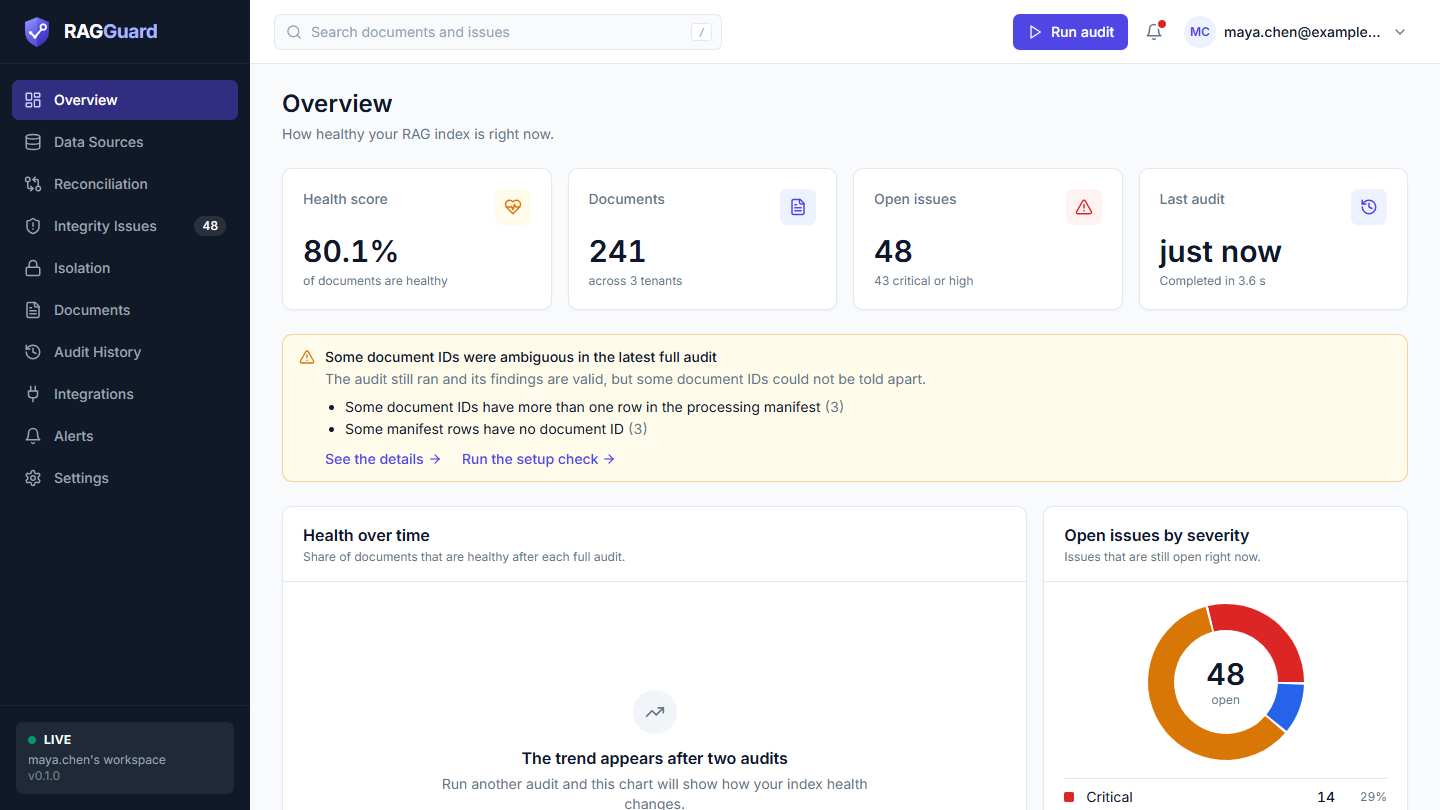
The notice, under the four cards: it names each problem the latest full audit found with document IDs, and offers two links.
When it appears. Only when the latest full audit recorded warnings about document IDs. Most of the time it is not there, and the page looks like the other screenshots in this chapter. Audits recorded before this notice existed have none.
What it says. It is amber, not red, because the audit still ran and its findings are valid. The heading is "Some document IDs were ambiguous in the latest full audit", the line under it is "The audit still ran and its findings are valid, but some document IDs could not be told apart.", and a list names each problem with how many there were in brackets:
| Line | What happened |
|---|---|
| Some document IDs belong to more than one file in S3 | Two files got the same document ID, so the audit looked at only one of them |
| Some document IDs have more than one row in the processing manifest | The manifest has several rows for one ID, so the audit used only one |
| Some manifest rows have no document ID | The rows could not be matched to a file or to vectors, so they were skipped |
Two links. See the details opens that audit's page, where each warning is explained with example IDs (Audit history). Run the setup check opens the Setup check card on Data sources (The Setup check), which shows the IDs of S3, the manifest and Qdrant side by side.
What to do. Read the details and fix the cause: change the key pattern so each file gets its own ID, remove extra copies or old rows, or map the right column as the document ID. Then run a full audit. The notice goes away when the next full audit has no ID warnings.
Health over time
A line chart of the health score after each full audit.
| Part | What it means |
|---|---|
| Title and line | Health over time: "Share of documents that are healthy after each full audit." |
| Horizontal axis | The time each full audit finished, written like Nov 9, 8:15 PM. |
| Vertical axis | The health score in percent. The bottom of the axis adjusts to your data: it is the lowest value minus 5 points, rounded down to a multiple of 10. The top is always 100%. |
| Dots | One per full audit. |
| Hover over a point | A small box shows the date and time, "NN.N% healthy", "N issues found" and "N documents". |
When it appears. The chart needs at least two completed full audits. Until then the card reads "The trend appears after two audits" with the text "Run another audit and this chart will show how your index health changes." It uses the most recent 30 completed full audits, oldest to newest. Scoped audits and verify audits are not drawn, because they cover only some documents.
How to read it. A flat line near 100% is the goal. A drop after an audit means something broke or a change landed; click Last audit to see which issues opened. A climb after a repair shows the fix worked. Screen readers get a hidden table titled "Health score after each full audit" with the columns Audit finished, Health score and Issues found.
Open issues by severity
A ring chart (a donut) of the open issues by severity, with a legend.
| Part | What it shows |
|---|---|
| Centre | The total number of open issues, with the word "open". |
| Ring | One coloured slice per severity: Critical red, High amber, Medium blue, Low grey. Hover over a slice to see its name and count. |
| Legend rows | One row per severity, in that order: a colour swatch, the name, the count and the share of all open issues as a whole percentage, for example 25%. An extra Info row appears only if some issue has that level. |
| Click a row | Opens Integrity Issues filtered to that severity. |
The shares are rounded, so they may not add up to exactly 100%.
If nothing is open, the card shows "No open issues" with "Nothing needs attention right now." For what each severity means, see Concepts: severity.
What to do next. Work from the top: Critical first. These are things like deleted content that users can still receive, or wrong-tenant vectors.
Issues by type
Horizontal bars, one per type of problem that has open issues.
| Part | What it shows |
|---|---|
| Title | Issues by type: "What is wrong, across all open issues. Select one to see those issues." |
| Label | The issue type, for example Missing embeddings, Stale document version or Orphan vectors. |
| Bar | Its length compares the type with the biggest one. |
| Number | How many open issues have that type. |
| Order | Most issues first. Equal counts are ordered by name. |
| Click a bar | Opens Integrity Issues filtered to that type. |
The card only appears when at least one type has open issues. For what each type means, see Integrity issues.
What to do next. The biggest bar is often one root cause. Many Stale document version issues at once, for example, can mean the hash your pipeline stores differs from the one S3 reports.
Document status
A stacked bar and five rows showing where all your documents stand after the last audits.
| Row | Meaning (the line shown under the name) | Colour |
|---|---|---|
| Healthy | Source, manifest and index agree | Green |
| Degraded | Searchable, with minor issues | Amber |
| Broken | Serious issues found | Red |
| Pending | Still being processed | Blue |
| Orphaned | Deleted at the source, vectors remain | Grey |
Each row shows its count and its share of all documents with one decimal, for example 3.5%. Click a row to open Documents filtered to that status. Hovering over a part of the bar shows its name and count.
The card appears only when RAGGuard knows at least one document. For how a status is decided, see Concepts: document status.
What to do next. A growing Pending count is normal after an upload and shrinks as your pipeline catches up. A Pending document that stays pending is judged once the grace period passes (Concepts: grace period). Look at Broken first.
Top open issues
The six open issues that need attention first.
| Part | What it shows |
|---|---|
| Title | Top open issues: "Most serious first, then most recently seen." |
| Each row | A severity badge, the issue title, then the document's file name and its tenant separated by a dot, then how long ago the issue was last seen (hidden on very narrow screens), and an arrow. Issues about a whole collection show "Whole tenant" instead of a document name. |
| Click a row | Opens that issue's panel. |
| Footer link | View all N open issues, which opens the full list. |
The card appears only when something is open. While loading it shows six placeholder rows. If the list cannot be loaded, the card shows its own error with Try again.
What to do next. Open the first row, read "What's wrong" and "Recommended fix", then plan the repair.
Tenant health
A table of how healthy each tenant's documents are. It appears when RAGGuard knows at least one tenant.
| Column | Meaning |
|---|---|
| Tenant | The tenant's name. Click it to open Documents filtered to that tenant. |
| Documents | How many documents the tenant has. |
| Healthy | How many of them are healthy. Pending documents are counted as healthy, as in the health score. |
| Health | The tenant's health score as a coloured badge: green at 90% or more, amber at 70% up to 90%, red below 70%. |
Title and line: Tenant health, "Share of each tenant's documents that are healthy, lowest first." The lowest scores come first, and tenants without a score come last. The card shows up to 8 tenants. If you have more, a link View all N tenants opens Documents, where you can pick a tenant from the filter. Clicking anywhere on a row works as well as clicking the name.
What to do next. A tenant far below the others usually has one specific cause, for example a missing folder in S3 or one failed ingestion run. Open the tenant, sort by Issues and look at the worst documents.
The Last audit card
The right-hand Last audit card summarises what the latest audit changed.
| Part | What it shows |
|---|---|
| Title and line | Last audit with a line such as "Full audit, 5 min ago". The kind is Full, Scoped or Verify. |
| Status badge | Running (blue), Completed (green) or Failed (red). |
| Red box | Only for a failed audit that recorded a reason: the reason itself. |
| Opened | New issues this audit found for the first time. |
| Reopened | Issues that had been resolved and came back. |
| Escalated | Open issues that became more severe, for example after a retrieval probe. |
| Resolved | Issues that were open and are no longer found. |
| Unchanged | Issues that were already open and were found again. This count includes an issue whose severity changed. |
| Retrieval probes | How many search probes the audit sent to the index to check whether bad content can really be returned. This line is missing when the audit found no issues at all or probing was off. It can read 0 when there were issues but none of them could be probed. |
| Footer link | View audit details, which opens that audit's page. |
Colours. Opened, Reopened and Escalated turn amber when above zero, because they are bad news. Resolved turns green when above zero. Unchanged and Retrieval probes stay plain.
While the audit is still running the card says "This audit is still running." instead of the counts.
What to do next. Zeros in Opened, Reopened and Escalated mean nothing got worse. Anything in Escalated is worth reading first, because the severity rose. For the meaning of these words, see Concepts: issue lifecycle.
Connection health
A live check of the systems RAGGuard depends on.
| Part | What it shows |
|---|---|
| Title and line | Connection health: "Checked live from the server." |
| A row per system | A dot (green when it responds, red when it does not), the system's name, a line of detail, and its response time in milliseconds when it has one. |
| Footer link | Manage data sources, which opens Data Sources. |
The rows are Issue ledger (RAGGuard's own database, see Concepts: ledger), S3 source, Manifest (Postgres) and Vector index (Qdrant). Examples of detail lines: "bucket 'my-bucket' reachable, hash mode 'metadata'", "rag_document_manifest: 21/21 columns mapped" and "1 collection(s), ~12000 points". A failing system shows its reason in red, such as "collection(s) not found: kb_main". Screen readers hear "connected" or "not responding" after each name.
The check runs when you open the page, and the result is reused for about 30 seconds. Refresh status on Data Sources re-checks right away.
What good looks like. Four green dots. What to do next. If one is red, open Data Sources and press Test on its card, then fix what the message says (Connect your data sources). An audit cannot succeed while a system it reads is unreachable.
Which cards appear and where
The layout adapts to your data so there are no empty boxes.
| Card | Appears when |
|---|---|
| The four cards, Health over time, Open issues by severity, Last audit, Connection health | Always, once at least one audit exists |
| ID warnings notice | The latest full audit recorded at least one warning about document IDs |
| Issues by type | At least one issue type has open issues |
| Document status | At least one document is known |
| Top open issues | At least one issue is open |
| Tenant health | At least one tenant is known |
If only one of Issues by type and Document status appears, it spreads across the full width. When there are no open issues and no tenants, Last audit and Connection health sit side by side instead of in a right-hand column. On a narrow screen every card stacks into one column.
States you may see
| State | What you see |
|---|---|
| Not connected (hosted) | The Connect your data card (above). |
| Loading | Grey blocks in the shape of the page: four card placeholders, two chart areas and the lists. The page does not jump when data arrives. |
| No audit yet | The No audit has run yet card and Connection health (above). |
| An audit is running | The blue banner, with the last results still shown beneath it. |
| After a failed first audit | The dashboard appears with a dash for the health score, 0 documents and 0 open issues. Last audit shows a red Failed badge and the reason. Open the audit's page for details. |
| Error | A card with "We couldn't load this", the reason and a Try again button. If the problem is that your systems are not connected, the card says Connect your data sources first with a Go to Data Sources button. See Sign in and find your way around. |
Tips and common mistakes
- The Overview shows 100% but I know a document is wrong. A high score means RAGGuard found no disagreement in the data it could read. If your vectors carry no
source_hash, RAGGuard cannot tell that a document changed. See Concepts: hash and version. - The health score and the score of an audit are different numbers. The card is calculated from all documents. An audit's score covers only the documents that audit checked (Concepts: health score).
- The trend chart is missing. It needs two completed full audits. Scoped and verify audits do not count.
- The "Last audit" card is not the last full audit. It shows the latest audit of any kind. The comparison of the three systems on Reconciliation uses the latest full audit.
- A fresh upload does not lower the score. Pending documents count as healthy. A document that is still unindexed after the grace period does lower it.
- Counts moved after a repair. Run an audit (or let the repair's verification run) so the Overview reflects it. The page does not update by itself unless an audit is running.
Related chapters
- Sign in and find your way around: the sidebar, the top bar and the three states of every page
- Connect your data sources: the three systems that Connection health checks
- Reconciliation: the three-way comparison and running audits
- Integrity issues: the list that most cards link to
- Documents: every document and its state
- Audit history: the page behind Last audit
- Concepts you need: health score, severity and the issue lifecycle